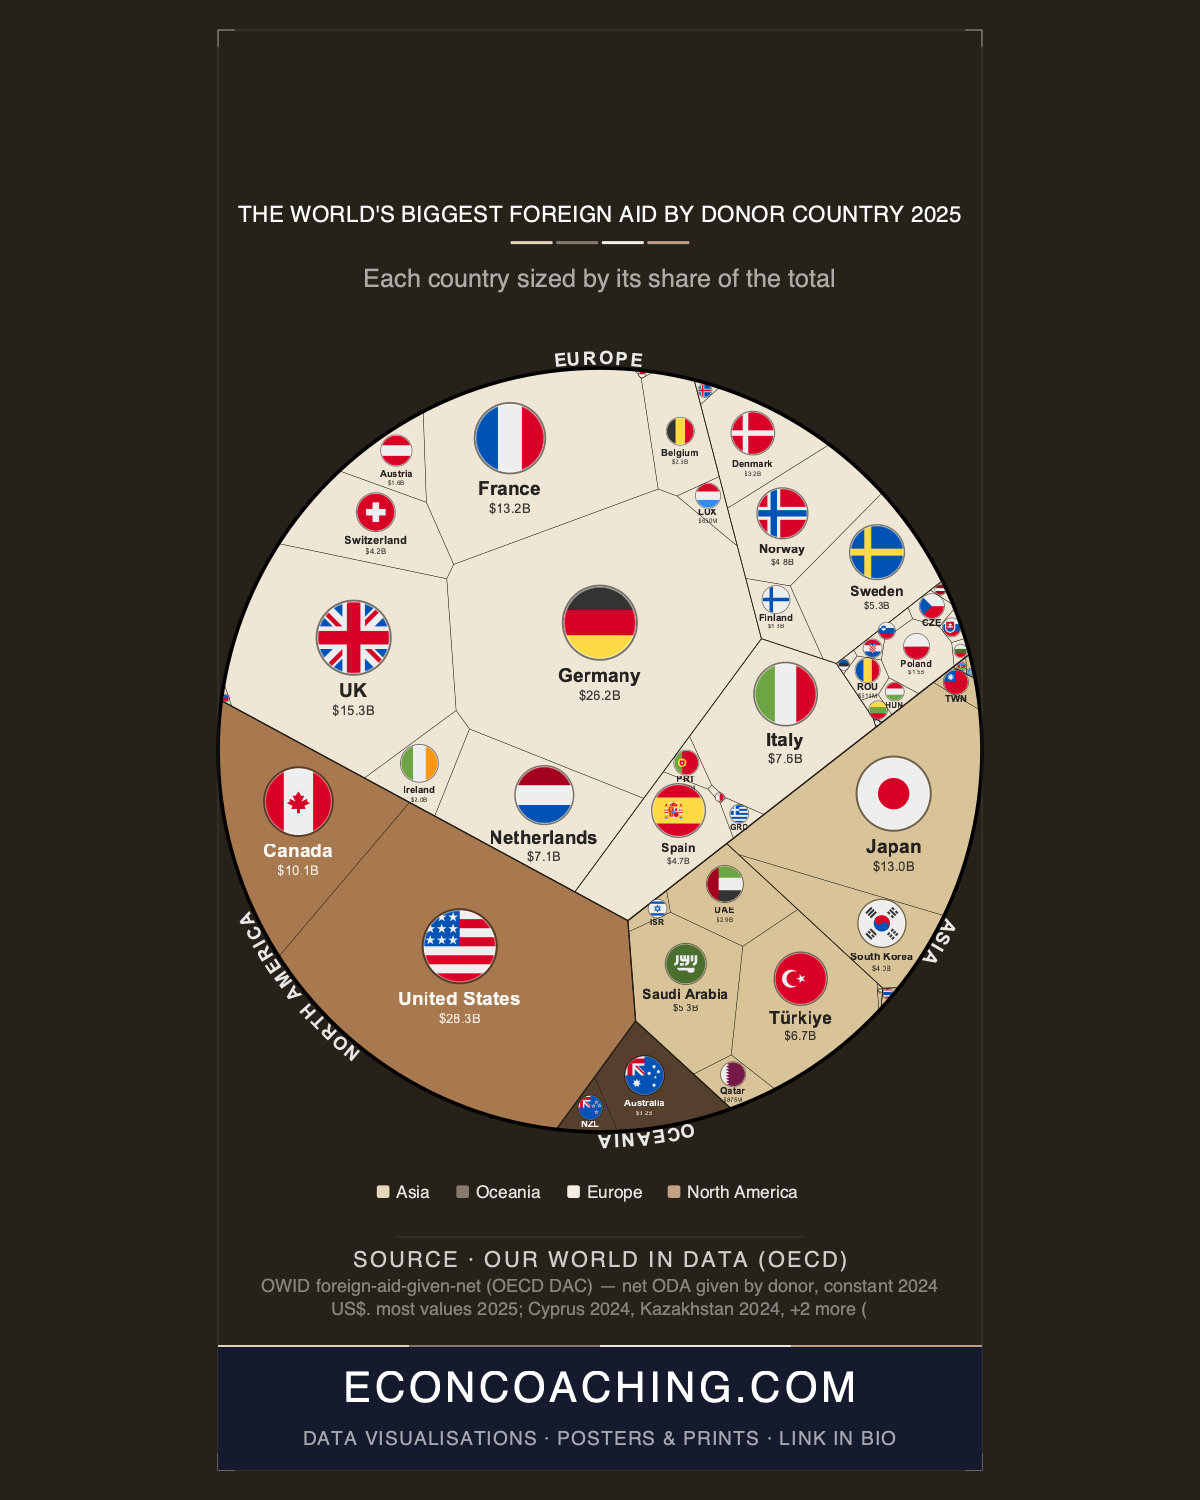
Germany's rectangle in the treemap sits fractionally larger than America's — by roughly $100 million across a combined total of more than $55 billion. That visual near-tie, barely distinguishable to the eye, marks the first time in the recorded history of Official Development Assistance that the United States has not been the world's largest foreign aid donor. It happened not because Germany increased its commitment, but because the US cut its own budget by 57% in a single year.
How Germany Became Number One Without Trying
Germany provided $29.1 billion in ODA in 2025 against the US figure of $29.0 billion, a lead so narrow that analysts at the OECD DAC described the outcome as accidental rather than principled. Germany's Federal Ministry for Economic Cooperation and Development, the BMZ, is itself in the process of cutting its foreign aid budget and restructuring the department that manages humanitarian assistance. Germany holds the top position by default, not by ambition. In 2012, the United States provided nearly double the foreign aid of the next largest donor. The dismantling of USAID in January 2025 ended that era with unusual abruptness.
The scale of the US withdrawal is visible throughout the data. US humanitarian aid alone fell from approximately $14 billion in 2024 to $3.7 billion in 2025, a drop of more than 73%. The United States had funded approximately 47% of the global humanitarian appeal in 2024, a share that no other donor can absorb quickly or completely. A February 2026 Lancet study projected that aid cuts of this magnitude could lead to at least 9.4 million additional deaths by 2030 if funding trends continue at the current pace.
The Largest Single-Year ODA Drop Ever Recorded
Total DAC ODA fell to $174.3 billion in 2025, down roughly 23% from the prior year. April 2026 OECD preliminary data confirmed this as the largest single-year decline since the OECD began tracking the figure. What makes 2025 structurally different from previous periods of aid contraction is that all five of the OECD's top donors declined simultaneously: Germany, the United States, the United Kingdom at $15.3 billion, France at $13.2 billion, and Japan at $13.0 billion all cut their budgets in the same calendar year. There is no historical precedent for that alignment. Canada at $10.1 billion, Italy at $7.6 billion, and the Netherlands at $7.1 billion round out the top eight, but none of their contributions offset the volume lost from the top five.
Aid to Ukraine provides additional context. ODA flowing to Ukraine in 2025, including EU institutional contributions, reached $44.9 billion, the largest volume of ODA ever directed to a single country in history, exceeding total bilateral ODA to all Least Developed Countries or to all of sub-Saharan Africa combined. That concentration effect means the headline DAC total of $174.3 billion, already reduced by 23%, is distributed in ways that leave low-income countries outside the Ukraine context disproportionately exposed to the withdrawal of US funding.
Dollar Rankings and the Generosity Problem
The treemap's cell sizes are proportional to total ODA volume, which systematically rewards large economies. The US at $29.0 billion gives approximately 0.22% of its gross national income, well below the UN's 0.7% target that has stood since 1970. Norway, ranked 12th globally with $4.8 billion, comfortably exceeds that threshold and led all countries in ODA as a share of GNI in 2024. Sweden, ranked 10th at $5.3 billion, has exceeded the 0.7% target every year since 1975, a 50-year streak, though its right-wing government abandoned the 1% commitment in 2022 and the ratio had fallen to 0.79% by 2024. The Nordic countries built statutory aid budgets directly tied to GNI in the 1970s, insulating commitments from year-to-year political cycles. That structural design explains why Norway and Sweden consistently top generosity rankings even as their raw dollar totals place them outside the top ten.
Australia's trajectory runs in the opposite direction. Ranked 16th with $3.2 billion, Australia's share of total DAC ODA has fallen from 3.18% in 2014 to 1.89% in 2025, nearly halved over a decade as other donors scaled up while Australia's contribution stagnated.
The Donors Outside the Official Club
Ranked 9th globally with $6.7 billion, Türkiye is not an OECD DAC member and therefore sits outside the institution's official donor classification, yet by volume it outranks Sweden, Norway, and every other individual European country except Germany, the UK, France, and the Netherlands. Türkiye's aid extends to over 170 countries, and in multiple recent years it ranked as the world's number two humanitarian donor by volume and number one by GDP share. The non-DAC category extends further: Saudi Arabia, the UAE at $2.9 billion, and Qatar all appear in the global top 25 yet are routinely excluded from headline ODA rankings. The UAE boosted its ODA by 55.5% in a single year, driven heavily by humanitarian aid for Palestine, and UN Office for the Coordination of Humanitarian Affairs data named it the world's third-largest humanitarian donor for 2025, providing $1.46 billion or 7.2% of all UN-tracked aid. Including these donors shifts the geographic distribution of global generosity significantly toward the Middle East and Asia.
South Korea's arc is worth noting separately. Ranked 15th with $3.99 billion, South Korea surged its ODA by 24.8% in 2024 to reach its highest ODA-to-GNI ratio of 0.21% since joining the OECD DAC in 2010. South Korea was itself a major recipient of international assistance in the post-Korean War period, making its ascent to the global top 15 within 15 years of joining the donor community a trajectory with few modern parallels. Europe collectively accounts for 57.9% of all tracked ODA, approximately $104.3 billion, with North America contributing 21.3% and all of Asia combined contributing 18.6%.
What Comes After the Collapse
The 2025 data represents a structural break, not a cyclical trough. USAID was a permanent institution built over decades; its dismantling cannot be reversed quickly even if political conditions change. The gap it leaves in humanitarian financing, vaccine programmes, and food security systems will not be filled by Germany's accidental number-one ranking or by incremental increases from South Korea and the UAE. The OECD DAC's preliminary April 2026 figures are the first data point in what may be a multi-year reconfiguration of who funds global development, on what terms, and with what conditions attached.
For more data-driven analysis of global economics and the trends reshaping the world economy, visit econcoaching.com.
Take this one home
Get this visualisation as a download, wallpaper, or printed poster.
← Back to all visualisations & articles
Follow Everything Econ: YouTube · TikTok · X · Instagram · Facebook