
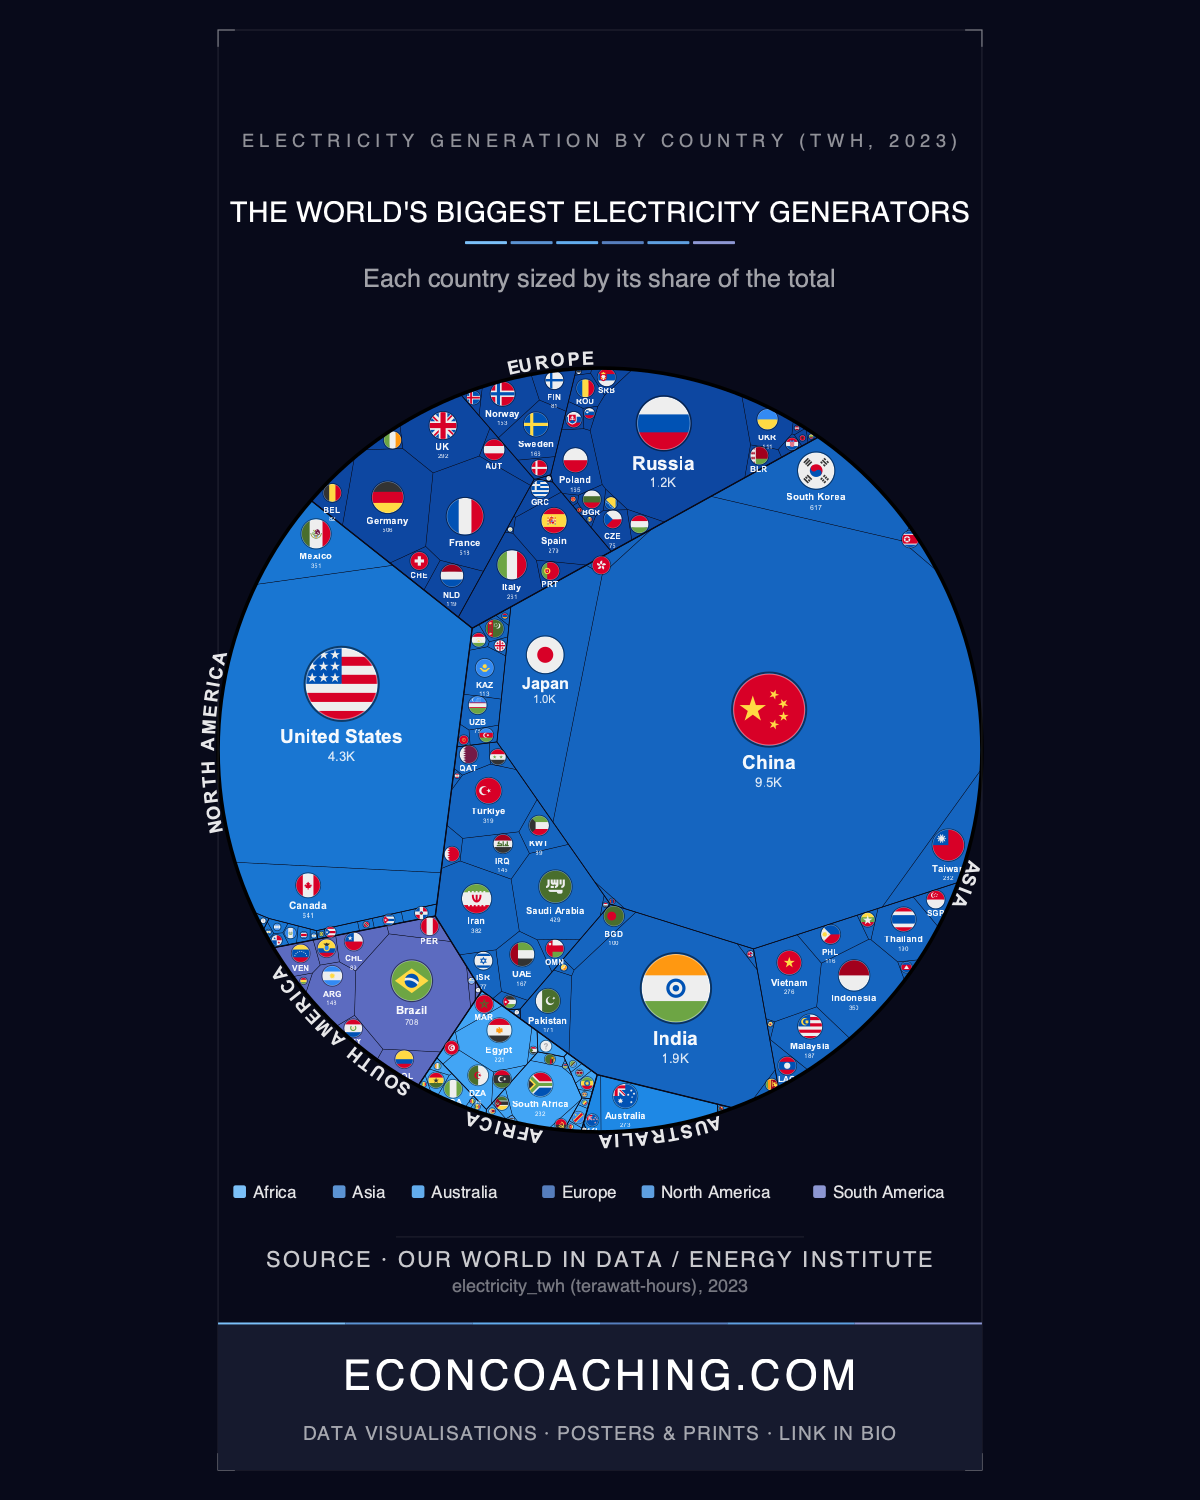
China generates 9,456 TWh of electricity per year — more than the entire Western Hemisphere combined. North America's 18.2% and South America's 4.3% of global output add up to 22.5%, still less than China's 31.9% alone. The treemap accompanying this article makes that disparity physical: China's block consumes roughly a third of the entire chart, dwarfing not just individual countries but entire continents. The treemap resizes the world by what it actually generates, and the result bears no resemblance to any map of land mass, population, or GDP.
How China Built a 30-Year Lead
China overtook the United States as the world's largest electricity producer in 2011, following three decades of coal-powered industrialisation. In 1990, the two countries contributed roughly equal shares of global output; by 2023, China's share was more than double America's 14.4%. China added 216.9 GW of solar capacity in 2023 alone — a 148% year-on-year increase representing the largest annual renewable capacity addition ever recorded globally, according to China's National Energy Administration. China accounted for 37% of global solar and wind generation in 2023, and its output from those two sources alone is sufficient to power the entire country of Japan, the world's fifth-largest generator at 1,007 TWh. The counterpoint to that story is that China still derives roughly 55% of its electricity from coal and carries a carbon intensity of 581 gCO2/kWh, well above the global average of 480 gCO2/kWh. China is simultaneously the world's largest clean energy deployer and its largest coal-fired electricity system — scale and decarbonisation are not the same thing.
The United States and the Rising Middle Tier
The United States at 4,254 TWh ranks second globally, but its 14.4% share illustrates how far ahead China has pulled. India at 1,918 TWh is now a firm third, having more than tripled output from roughly 600 TWh circa 2000 — the fastest sustained electricity growth of any large economy over that period — though coal still accounts for approximately 75% of India's generation. Russia (1,178 TWh, #4) and Japan (1,007 TWh, #5) complete the top five. The Asia region — including Middle East, Central, South, Southeast, and East Asia — produces 57.5% of all global electricity; East Asia alone (China, Japan, South Korea, Taiwan, and Hong Kong) accounts for 38.4%.
France and Brazil: Divergent Routes to Low-Carbon Output
France's 519 TWh (rank #9) carries a structural distinction absent from any other large economy: nuclear power accounted for 65% of its generation in 2023. That outcome traces directly to a decision made in 1974, following the oil crisis, when France began a construction programme that resulted in 52 reactors between 1975 and 1990 — transforming the country from a net electricity importer into Europe's dominant exporter. EDF's nuclear fleet gives France one of the least carbon-intensive grids in the developed world.
Brazil's path is different in origin but similarly low-carbon in result: 93.1% of its 708 TWh came from renewables in 2023, led by hydropower at roughly 60%, with wind contributing approximately 14% and solar 7.3%. Brazil recorded the world's second-largest annual increase in wind and solar generation in 2023, behind only China. The qualification is geographic: Brazil's renewables share is partly a function of abundant river systems rather than policy transformation alone, and heavy reliance on hydropower creates fragility — drought years have repeatedly forced fossil fuel back-up, as Brazil experienced through the 2010s.
Africa's Access Deficit
Africa generates 928 TWh — 3.1% of global electricity output — for a population of roughly 1.4 billion, or approximately 18% of the world. In the treemap, the entire continent occupies a fraction of China's rectangle. That compression reflects both a supply gap and suppressed demand: with per-capita energy use more than three times below the global average, Africa's true electricity need, if universal access were achieved, would be substantially larger than current output implies. The World Bank's 2025 Tracking SDG7 Report found that 565 million people in Sub-Saharan Africa still lacked electricity access in 2023, representing 85% of the global electricity access deficit, up from 50% in 2010, as population growth outpaced grid expansion over that period.
Nigeria is the starkest case. Africa's most populous nation generates only 41 TWh (rank #62 globally) while simultaneously holding the world's largest electricity access deficit — 86.6 million people without power. South Africa, at 233 TWh, generates roughly 25% of the continent's total output yet ranks only #22 globally. Mission 300, the joint World Bank and African Development Bank initiative targeting electricity access for 300 million people by 2030, and the African Union's 300GW renewables target represent the institutional response to that deficit; whether either programme can outrun demographic growth is the central question for the continent's energy trajectory.
What Volume Rankings Don't Capture
Australia generates 273 TWh (#20 globally), ranking higher than Nigeria, Pakistan, and all of Central Africa combined despite a population of 26 million — reflecting exceptionally high per-capita energy intensity rather than industrial scale. Vietnam (#19, 277 TWh) generates only marginally more than Australia despite having nearly four times its population. Japan (#5) has the highest share of fossil power generation among G7 nations at 69%, with clean electricity making up less than a third of its mix, below the global average — meaning a high absolute ranking coexists with a carbon-heavy generation structure. High generation volume reflects economic intensity, not decarbonisation leadership.
The 2023 data lands as countries are committing to the infrastructure that will determine their electricity mix for the next 30 to 50 years: China is deploying solar at a pace with no historical precedent, France is rebuilding its nuclear fleet after the 2022 capacity crisis, India is adding both coal and renewables at scale, and Sub-Saharan Africa is negotiating whether its coming build-out will be financed in fossil fuel or in the clean energy systems the African Union has targeted. Those decisions, made between now and 2030, will determine whether the next edition of this chart looks substantially the same or begins to redistribute what is currently a remarkably concentrated global grid.
For more data-driven analysis of global economics and the trends reshaping the world economy, visit econcoaching.com.
Take this one home
Get this visualisation as a download, wallpaper, or printed poster.
← Back to all visualisations & articles
Follow Everything Econ: YouTube · TikTok · X · Instagram · Facebook