
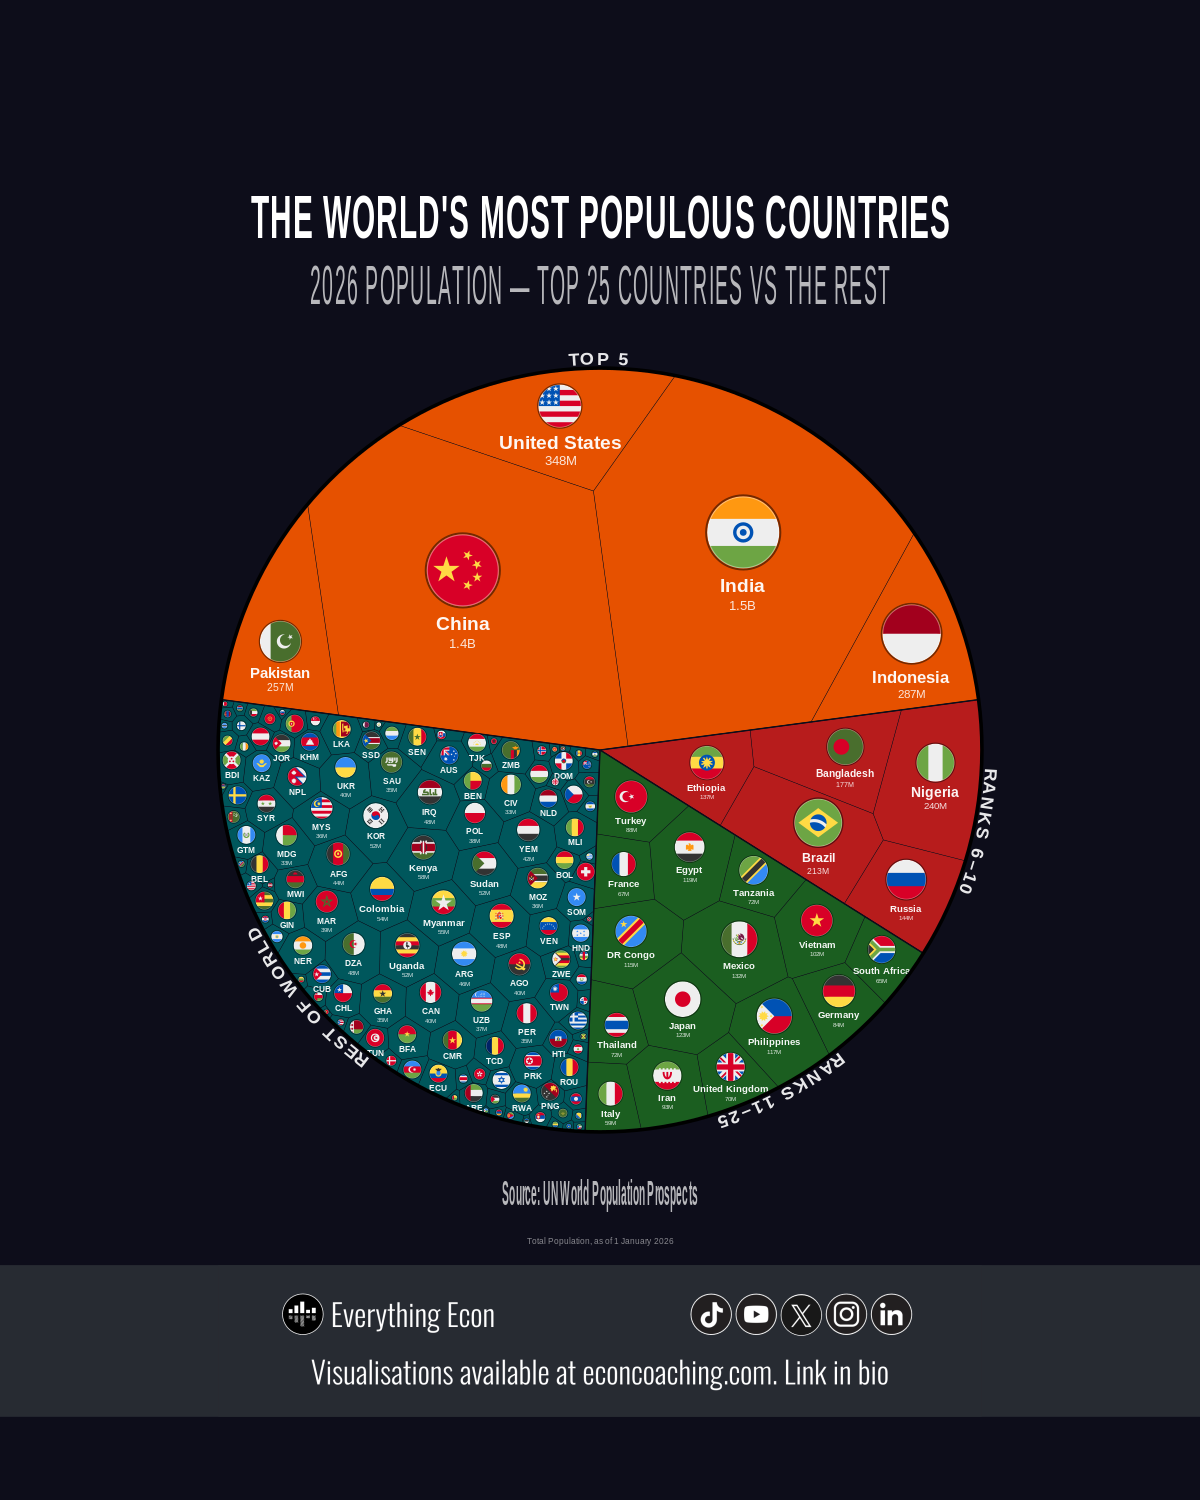
The treemap accompanying this article resizes every country by population rather than land area, and the result reorders intuitions built up over a lifetime of reading conventional maps. The top 5 countries — India, China, the United States, Indonesia, and Pakistan — together hold roughly 3.77 billion people, or about 45.7% of humanity. The countries outside the top 25 account for the majority of the world’s nations but a minority of its people. That concentration tells the first important story. The second is that the composition of the top bands is changing, and the direction of change is one-way.
How Concentrated the Top of the Ranking Actually Is
India at 1.470 billion and China at 1.414 billion together represent more than 34% of the global total of 8.25 billion. Add the United States (348.2M), Indonesia (286.8M), and Pakistan (257.2M), and the top 5 account for nearly 46% of the world’s population. The next five — Nigeria (240.0M), Brazil (213.2M), Bangladesh (176.8M), Russia (143.6M), and Ethiopia (137.2M) — add a further 12.5%. That means the top 10 together hold approximately 58% of humanity, concentrated in just ten countries out of more than 160 covered in the data.
The gap between ranks 1 and 2 is now approximately 56 million people and widening. India officially surpassed China in April 2023, ending a demographic reign that UN records trace back to at least 1950. In 1971, both countries had nearly identical fertility rates of just under 6 births per woman. China’s one-child policy, introduced in 1980 and not fully dismantled until 2015, sharply diverged their trajectories. China’s population peaked at approximately 1.426 billion in 2022 and is now declining. UN projections indicate it could fall below 1 billion before 2100 — a loss of more than 400 million from peak — though those projections carry real uncertainty given China’s recent pro-natalist policy shifts, whose effect on actual fertility behaviour remains unknown.
Movement Inside the Top 10 and What It Signals
The most analytically significant recent movement in the top 10 is Ethiopia’s displacement of Japan. Ethiopia now ranks 10th at 137.2 million; Japan ranks 12th at approximately 122.8 million. As recently as 2005, Ethiopia’s population was under 75 million. It has nearly doubled in two decades, driven by a fertility rate that, while declining, remains well above replacement level. Japan’s trajectory runs in the opposite direction: its 2025 National Census confirmed a 3.1-million population drop in five years, the fastest pace of decline ever recorded there, and roughly triple the rate of the previous five-year period. Japan has now lost approximately 5 million people since its 2010 peak of 128 million.
South Korea, which does not appear in the top 10, illustrates the same structural force at greater speed. It crossed into “super-aged” status — defined as more than 20% of the population aged 65 and over — at the end of 2024, reaching that threshold in roughly 7 years compared to 11 years for Japan and 19 years for Europe. The UN projects South Korea’s population will fall from approximately 52 million today to 22 million by 2100. Population decline at this scale is not purely negative — automation, AI productivity gains, and selective immigration can partially offset workforce shrinkage, and lower population density reduces housing and environmental pressure — but the pace of ageing in Northeast Asia creates sovereign debt and pension system stresses that productivity alone is unlikely to fully absorb.
Nigeria and the Countries Approaching the Top Band
Nigeria at rank 6 with approximately 240 million people is the fastest-growing country among the world’s ten largest. Its median age is 18.3 years, and it is on track to surpass the United States as the world’s third most populous country shortly before 2050. The gap between Nigeria and the United States — currently about 108 million — will close as Nigeria’s population expands and America’s grows only modestly by comparison.
Raw demographic scale does not translate automatically into economic weight. Nigeria’s GDP per capita remains far below that of the countries it is displacing in population rank, just as Bangladesh at rank 8 with 176.8 million people ranks among the world’s lower-income economies despite its demographic scale. Africa’s youth bulge — the DRC has a median age of 15.9 years and a total fertility rate of approximately 6 children per woman, nearly three times the global average of 2.3 — will only function as a demographic dividend if education, healthcare, and formal employment scale in parallel with population growth. Without those investments, rapid growth compounds unemployment and fiscal pressure rather than generating it.
The Shrinking Share of the Countries Outside the Top 25
Half of all projected population growth between now and 2050 is expected to concentrate in just nine countries: India, Nigeria, DRC, Pakistan, Ethiopia, Tanzania, the United States, Uganda, and Indonesia — seven of which are in Africa or South Asia. The countries outside the top 25 are not where demographic momentum is being generated. Europe held roughly 22% of world population in 1950; by 2026 that share has fallen to 10.1%, with a median age above 42.8 years. Africa held about 9% in 1950, has reached 19.0% (1.56 billion people) in 2026, and is projected to account for 1 in 3 people on Earth by 2100.
The global growth rate itself has decelerated sharply — 0.84% per year in 2026, down from a peak above 2.3% in the 1960s. World population doubled from 3 billion in 1959 to 6 billion in 1999 in 40 years. At the current pace, the next doubling would take over 200 years.
What the Rankings Point to from Here
The dominant demographic dynamic visible in the 2026 rankings is redistribution rather than explosion: population is concentrating toward South Asia and Sub-Saharan Africa as East Asia and Europe lose share. Labor markets, sovereign debt sustainability, AI investment, and geopolitical power calculations over the next two decades will all be shaped by this shift — not by the aggregate total, but by where within the ranking that growth is and is not occurring.
For more data-driven analysis of global economics and the trends reshaping the world economy, visit econcoaching.com.
Take this one home
Get this visualisation as a download, wallpaper, or printed poster.
← Back to all visualisations & articles
Follow Everything Econ: YouTube · TikTok · X · Instagram · Facebook