
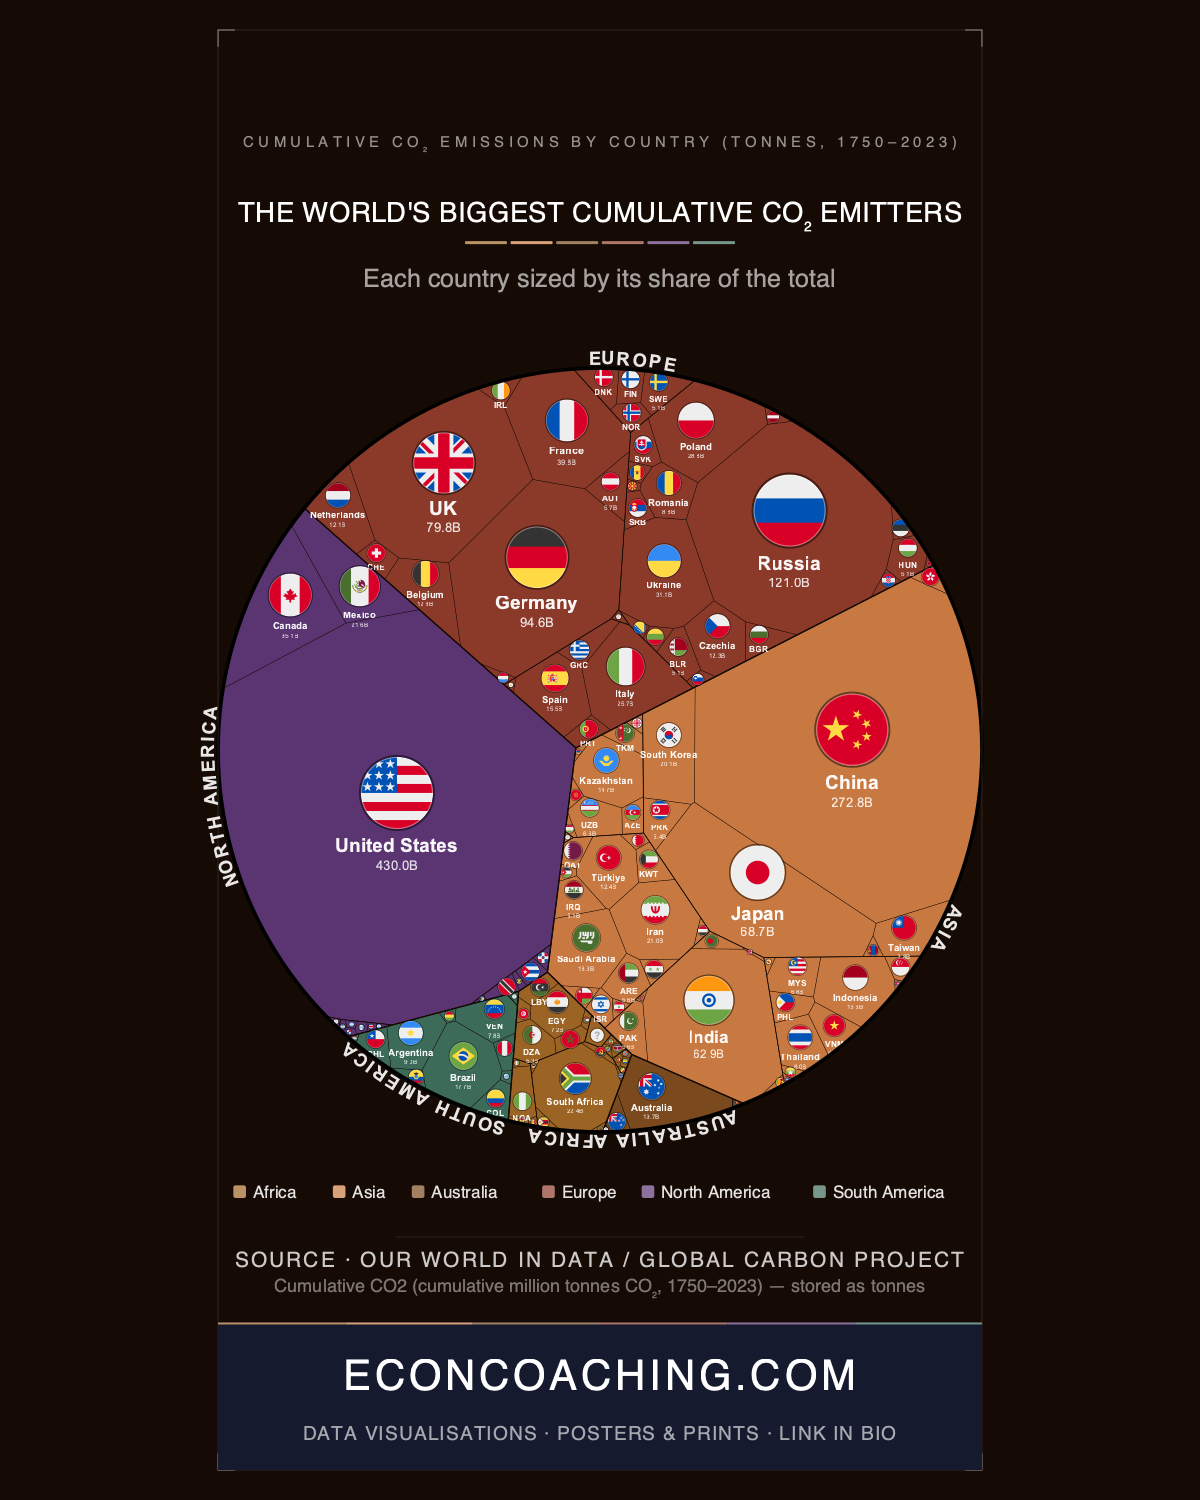
The United States has emitted 430 gigatonnes of CO₂ since 1750 — 24.36% of every tonne ever released — while housing roughly 4% of today's global population. In the treemap accompanying this article, where cell area maps to cumulative emissions rather than geography or economic weight, that rectangle dominates in a way that directly inverts the standard assumption that China is the world's defining polluter. China's block, at 272.8 GtCO₂, is roughly 63% the size of America's, and the vast majority of China's total was emitted after 1980.
One Country, More Than China and India Combined
The US figure of 430 GtCO₂ exceeds the combined total of China (272.8 GtCO₂) and India (62.9 GtCO₂) — two countries that together account for nearly 2.85 billion people, more than eight times the US population. On absolute cumulative tonnage, one country with 4% of the world's people has put more carbon into the atmosphere than both the world's second and seventh largest historical emitters combined. Per-capita cumulative comparisons do qualify this: Canada (35.1 GtCO₂) and Australia (19.65 GtCO₂) have smaller absolute totals but populations proportionally smaller still, meaning their per-person historical burden exceeds America's. But atmospheric CO₂ concentration responds to absolute mass, not per-person fractions, and the US lead on that measure is unambiguous.
Europe's Structural Legacy and the Pre-1882 World
Until 1882, the United Kingdom alone accounted for more than half of all global cumulative CO₂, the direct consequence of being the birthplace of the Industrial Revolution and the world's first economy powered by coal at scale. The UK now ranks fifth with 79.8 GtCO₂ (4.52%), having been surpassed by Germany in the 1980s following continental Europe's post-war industrial expansion. Germany at 94.6 GtCO₂ (5.36%) is now Europe's largest single historical emitter — a figure that exceeds India's entire cumulative total despite Germany's population being roughly 84 million against India's 1.44 billion. Europe (31.0%) and North America (28.0%) together account for approximately 59% of all historical emissions, from regions that today house roughly 17% of the world's population.
China's Annual Surge and the Cumulative Lag
Annual emissions complicate the historical picture substantially. China currently emits approximately 12.3 GtCO₂ per year — more than the US and EU combined — making it the world's largest current polluter by a considerable margin. On a long enough timeline, China's cumulative share will grow. But Carbon Brief's 2025 finding that China's annual emissions have been flat or falling for approximately 21 months, driven by rapid expansion of wind, solar, and nuclear capacity, suggests the gap between the US's 24.36% and China's 15.46% may persist longer than climate models had projected. Production-based accounting further complicates China's culpability: a substantial share of China's post-1980 emissions is embedded in goods exported to and consumed in Europe and North America, and a consumption-based framework shifts part of that cumulative burden back to its wealthy trading partners — widening the historical gap rather than narrowing it.
Africa, India, and South America: The Absent Footprints
Africa accounts for just 3.0% of all cumulative CO₂ since 1750 — 52.6 GtCO₂ across 54 countries and approximately 1.4 billion people — despite ranking among the most climate-vulnerable regions on earth. Within that already-small total, South Africa (22.4 GtCO₂) alone accounts for 42.5% of the continent's entire cumulative share, more than all of Central, East, and West Africa combined (approximately 7.8 GtCO₂) and more than all of North Africa (approximately 17.9 GtCO₂). South America as a continent (46.5 GtCO₂, 2.6%, population approximately 440 million) has contributed less historically than Germany's 84 million people produced. India (62.9 GtCO₂, 3.56%), with a population of 1.44 billion, has emitted less cumulatively than Germany alone. With the UNFCCC Loss and Damage Fund now operationally active following COP30, these asymmetries between who emitted and who absorbs the consequences are no longer a background condition — they are the basis on which climate finance obligations are being determined.
Ukraine and Australia: The Rankings' Structural Surprises
Two positions in the top 20 expose industrial legacies that rarely enter the public debate. Ukraine ranks tenth globally with 31.1 GtCO₂ (1.76%) — ahead of Mexico, South Korea, Australia, and Brazil — a direct legacy of its Soviet-era concentration in heavy metallurgy and coal extraction, primarily in the Donbas. Australia (19.65 GtCO₂, 1.11%, population approximately 26 million) carries a larger cumulative footprint than Brazil (17.72 GtCO₂, 1.00%, population approximately 215 million), placing it as the world's 17th largest historical emitter on one of the smallest population bases in the top 20. Both rankings are artefacts of fossil-fuel-intensive industrialisation in economies that built their productive capacity around coal and gas at a time when there was no alternative energy infrastructure to constrain them.
The US's 24.36% share — more than China and India combined, from a country with 4% of the global population — will anchor American climate diplomacy for the foreseeable future. COP30's finalised financing mechanisms draw directly on cumulative emissions data of exactly this kind, and with China's annual emissions now plateauing, the historical gap between the two largest contributors is unlikely to close as quickly as prior projections assumed, sustaining the political and legal pressure on the country that sits atop that ledger.
For more data-driven analysis of global economics and the trends reshaping the world economy, visit econcoaching.com.
Take this one home
Get this visualisation as a download, wallpaper, or printed poster.
← Back to all visualisations & articles
Follow Everything Econ: YouTube · TikTok · X · Instagram · Facebook