
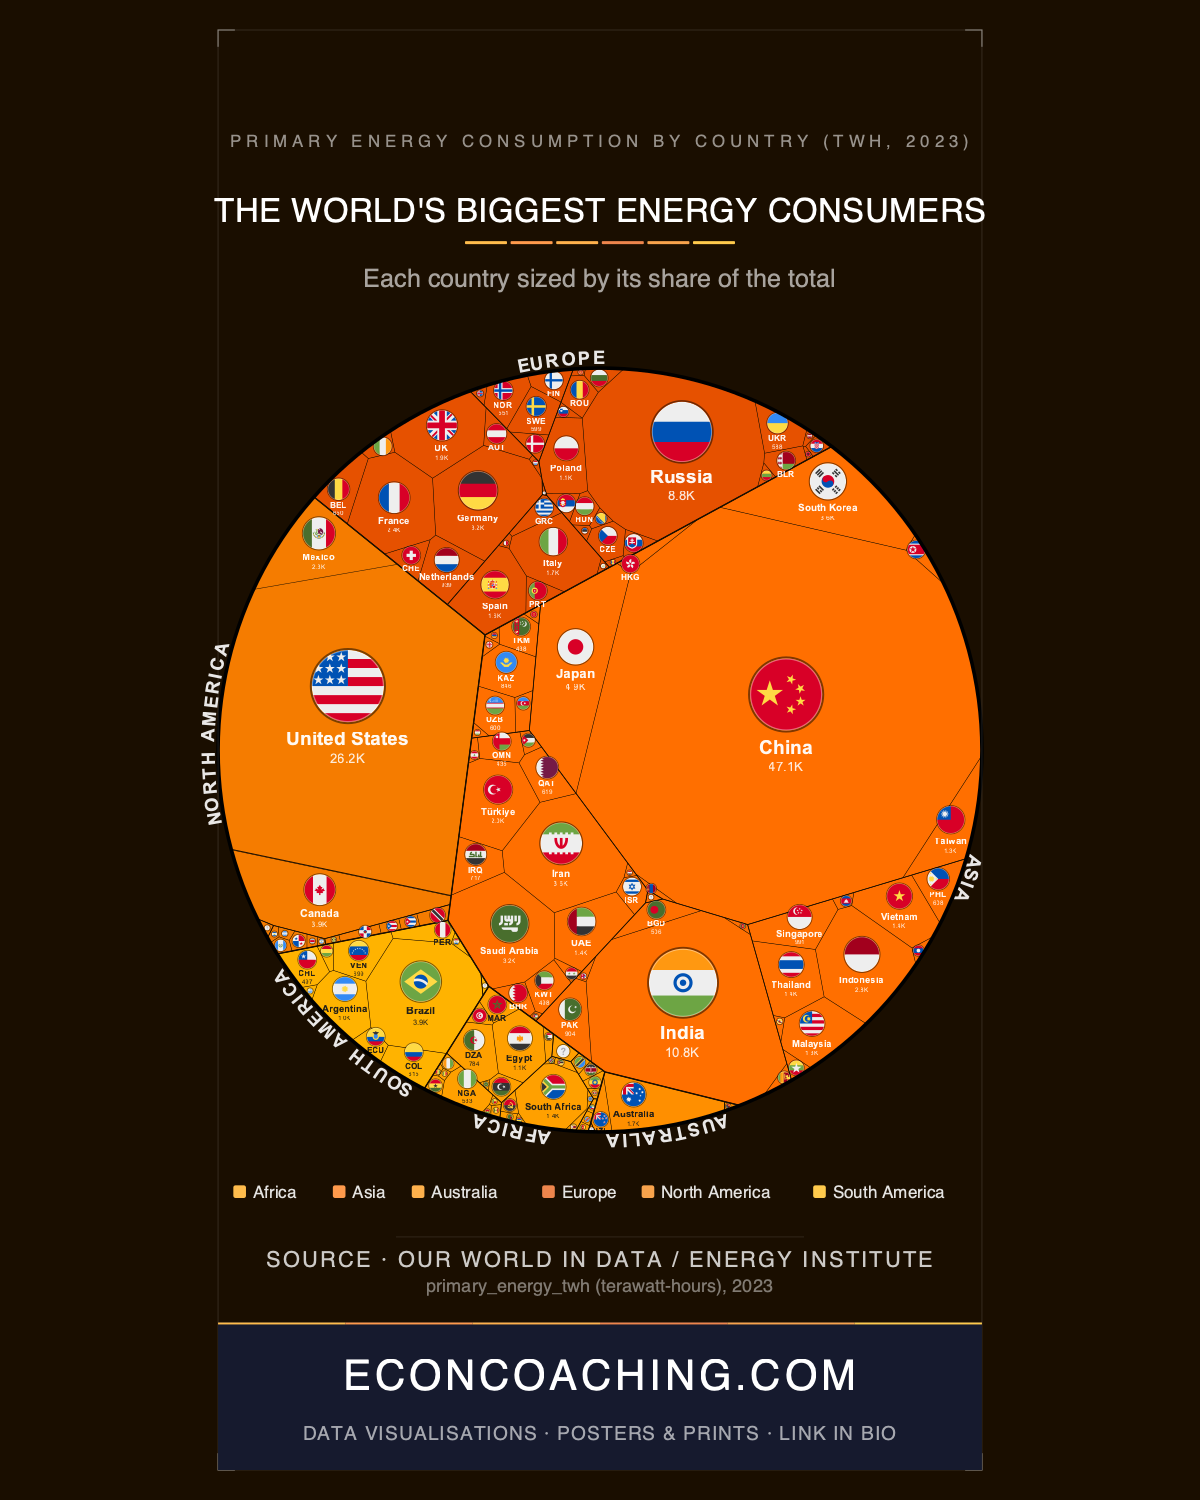
China consumed 47,072 TWh of primary energy in 2023 — more than Africa, South America, and Oceania combined, which together account for 15,113 TWh. That is not a rounding difference; China outconsumed those three continents by a factor of 3.1x. In the treemap accompanying this article, where cell area is proportional to energy consumption rather than land mass, China's block is the most disorienting feature on the chart. One country occupying 27.5% of a 171,191 TWh global total is the structural fact that underlies every climate, trade, and geopolitics conversation of the current decade.
How China Got Here, and What the Gap Actually Means
In 2000, China and the United States consumed roughly the same amount of primary energy. China overtook the US around 2010, ending approximately a century of American dominance, and by 2023 was consuming nearly 80% more than the United States (47,072 TWh versus 26,217 TWh). That acceleration — from parity to 80% above in roughly two decades — is one of the fastest energy-demand expansions in recorded history, driven by coal-powered manufacturing growth that made China the workshop of the global economy.
The size of China's block, however, requires analytical qualification. The United States generates approximately 20% more GDP per unit of energy than China, meaning China's larger absolute consumption partly reflects structural inefficiency in its industrial economy rather than proportionately greater productive output. At the same time, China installed more solar and wind capacity in 2023 than the rest of the world combined, according to the IEA. The country that holds the #1 position in total energy use also holds the #1 position in new renewable capacity additions — which will gradually decouple its consumption growth from carbon intensity, even if that process is not yet visible in the aggregate figures.
The United States and the Coal Collapse
At 26,217 TWh, the United States remains the world's second-largest energy consumer by a substantial margin, consuming 4.6x more than all 54 African nations combined despite having less than one-quarter of Africa's population (approximately 335 million versus 1.4 billion). US primary energy consumption peaked around 2007–2008 and had fallen roughly 7% from that peak by 2023, driven by efficiency gains, the structural shift from coal to natural gas, mild de-industrialisation, and the early stages of electrification. US coal consumption fell 17% in 2023 alone, reaching its lowest level since the 19th century — a figure that captures not just a cyclical shift but the accelerating obsolescence of a fuel that once defined American industrial power.
Africa's 5,702 TWh across 54 countries and 1.4 billion people is not a sign of efficiency. Approximately 600 million Africans still lack reliable electricity access, suppressing demand that would be far higher if the infrastructure existed. South Africa (1,368 TWh) accounts for 24% of the continent's total despite holding only about 4% of its population, consuming more than Nigeria (534 TWh) and Egypt (1,096 TWh) individually — the continent's two most populous nations.
India's Trajectory and the Asia Concentration
India consumed 10,828 TWh in 2023, growing approximately 7.3% — the fastest rate among major economies — while European consumption fell around 2.2% and US consumption edged slightly lower. India now consumes 2.2x more than Japan (4,859 TWh), yet has roughly 11x Japan's population, so its per-capita energy use still trails Japan's by about 5x. India's current 6.3% global share is broadly where China stood in the late 1990s. If India's economy and urbanisation continue on current trajectories, the prospect of it doubling or tripling that share over two to three decades is not speculative — it is the base case.
Asia as a whole consumed 94,204 TWh in 2023, or 55.0% of the global total. That figure exceeds Europe (16.7%), North America (19.5%), South America (4.4%), Africa (3.3%), and Oceania (1.1%) added together. The global centre of gravity in energy demand has shifted irreversibly eastward since 1990, when Europe and North America together held roughly 50% of global consumption. Their combined share has fallen to approximately 36% today, even as their absolute consumption remained relatively stable — meaning Asia's rise has not come from displacing Western consumption but from adding new demand on top of it.
The Per-Capita Inversions
The total-consumption ranking conceals a parallel league table that looks almost nothing like it. Canada (population approximately 38 million) consumed 3,888 TWh in 2023 — nearly identical to Brazil (3,854 TWh, population approximately 215 million). Canada's per-capita energy use is roughly 5.7x Brazil's, making it one of the world's most energy-intensive economies per person, reflecting extreme climate, resource extraction industries, and energy-intensive manufacturing. Qatar leads the world on a per-capita basis at approximately 817 GJ per person, driven by its petrochemical industry, extreme air-conditioning loads, and heavily subsidised domestic energy prices. Iceland (population approximately 370,000) consumed 64 TWh in 2023 — 60% more than the entire Democratic Republic of Congo (40 TWh, population approximately 100 million), a comparison that reflects geothermal abundance and aluminium smelting on one side, and acute energy poverty on the other.
Iran ranks eighth globally at 3,596 TWh — ahead of South Korea (3,558 TWh) and Germany (3,179 TWh) — despite decades of international sanctions that have suppressed investment and economic output. Iran's outsized energy footprint is sustained by the world's second-largest gas reserves and domestic prices that are among the most heavily subsidised anywhere, creating consumption levels that bear little relationship to market-priced economic output.
The Fossil Fuel Paradox
Despite record renewable energy output growing approximately 13% in 2023, fossil fuels still accounted for approximately 82% of global primary energy consumption — essentially unchanged from 2022. Global primary energy consumption itself hit a record high of approximately 171,000 TWh, even as COP28 in Dubai produced an unprecedented call to transition away from fossil fuels. The Energy Institute Statistical Review of World Energy 2024 makes clear that the clean energy transition is gaining speed in capacity additions while remaining nearly invisible in the aggregate fuel mix. Absolute fossil fuel consumption continued to rise even as renewables grew, because total demand grew faster than the renewable additions could offset.
With COP30 having concluded in Belém in November 2025, the policy question is whether the agreements reached there will translate into the kind of structural demand destruction that the 2023 data shows advanced economies beginning to achieve — a genuine decoupling of economic output from energy intensity — or whether Asia's continued industrialisation will swamp those gains in the global total for another decade. The answer depends heavily on decisions made in Beijing and New Delhi over the next several years, not in Brussels or Washington.
For more data-driven analysis of global economics and the trends reshaping the world economy, visit econcoaching.com.
Take this one home
Get this visualisation as a download, wallpaper, or printed poster.
← Back to all visualisations & articles
Follow Everything Econ: YouTube · TikTok · X · Instagram · Facebook