
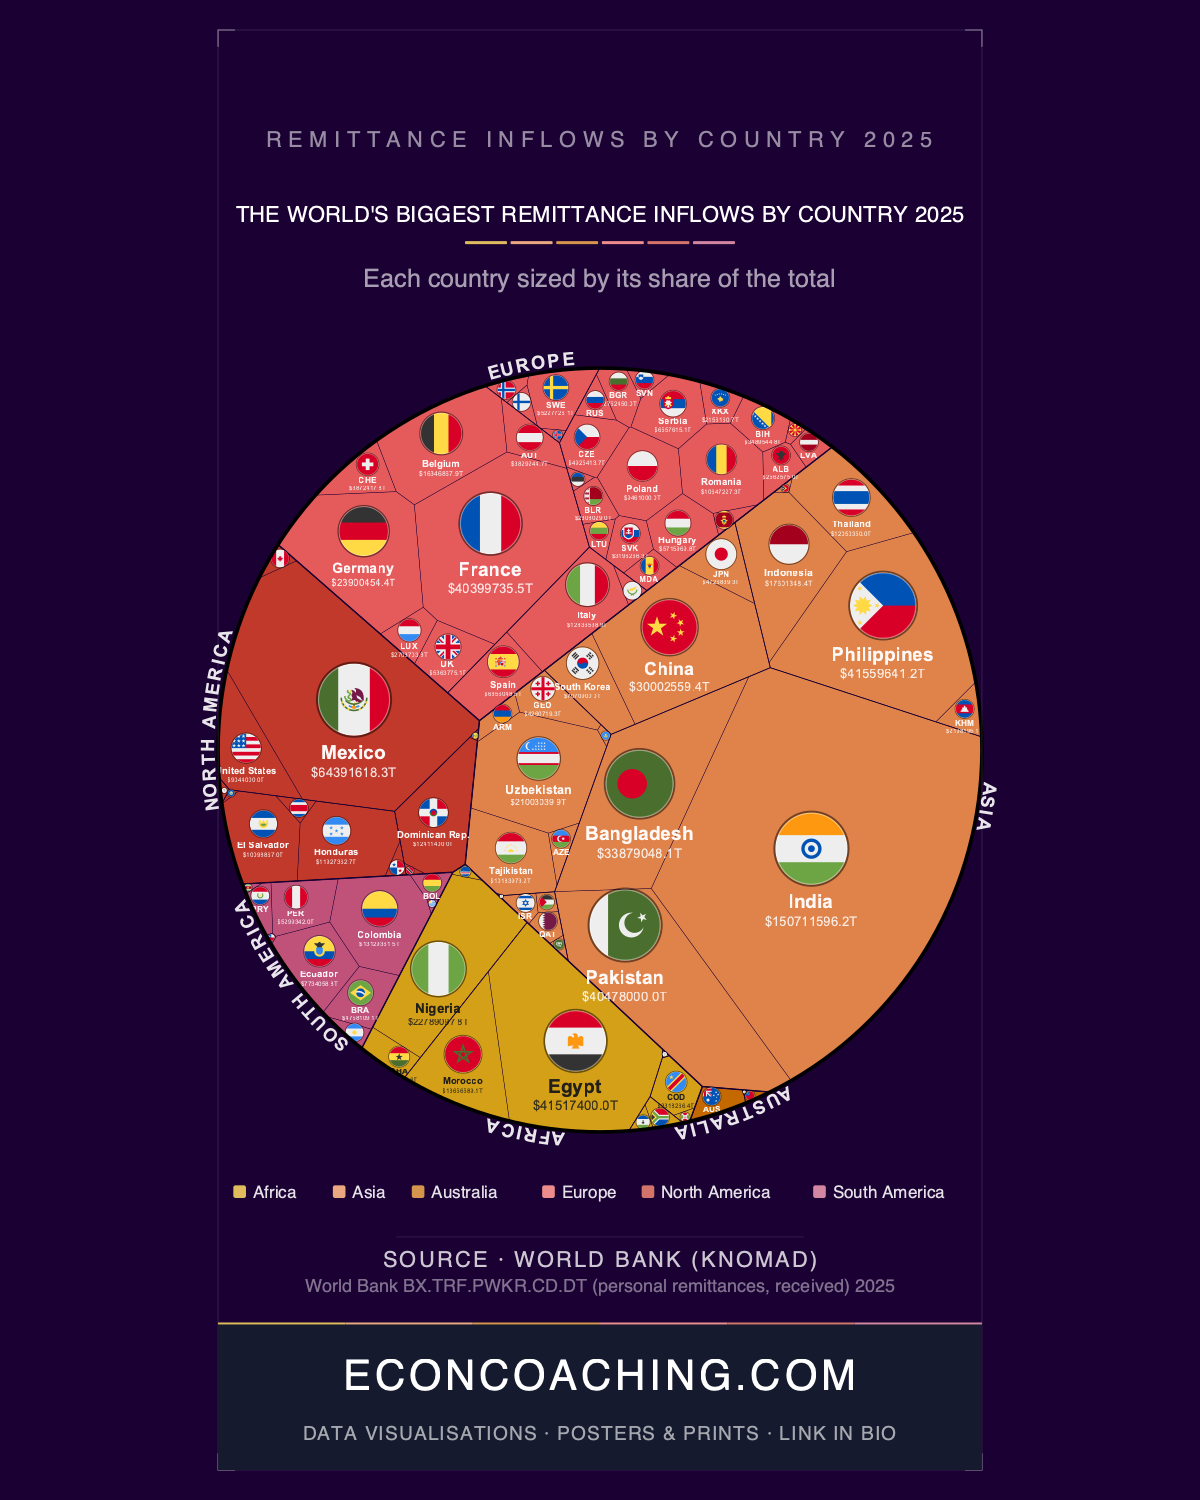
France ranks sixth in the world for remittance inflows — wedged between Pakistan ($40.5B, rank 5) and Bangladesh ($33.9B, rank 7), according to 2025 World Bank KNOMAD data. That placement is the most disorienting fact in the dataset, and the treemap accompanying this article makes it impossible to ignore: France, Germany, and Belgium appear as substantial rectangles in a chart normally occupied by India, Mexico, and the Philippines. Cell area is proportional to dollar value, not geography or income level, and the visual result obliterates the assumption that remittances flow exclusively to poor nations. The explanation reveals something fundamental about how international statistics define the term — and why that definition matters enormously for reading the global picture.
India's Singular Dominance Sets the Scale
India's $150.7B in remittance inflows represents 18.74% of the global $804B total — the first time the aggregate has crossed $800B. India alone exceeds the combined inflows of the next three ranked countries: Mexico ($64.4B), the Philippines ($41.6B), and Egypt ($41.5B), whose combined $147.5B falls just short. The gap with China is even more striking: India receives nearly five times China's $30.0B despite comparable population size and, by some counts, a smaller global diaspora. India's dominance reflects successive Gulf migration waves, a technology diaspora concentrated in the US and UK, and Reserve Bank of India reporting improvements that now capture flows previously unmeasured. India has been the top recipient since overtaking China around 2008, and its share of global flows has risen from roughly 12% in the late 2000s to 18.7% today.
South Asia as a whole — India, Pakistan ($40.5B), and Bangladesh ($33.9B) — totals $225.1B, capturing 28% of global remittances. That three-country sub-regional figure exceeds all of Europe's $187.5B, itself the world's second-largest receiving region. A continent of 44 nations receives less than three countries in a single sub-region.
The Europe Anomaly: Cross-Border Wages, Not Diaspora Transfers
The $187.5B that Europe receives is the figure that demands the most analytical scrutiny. France, Germany ($23.9B), and Belgium ($16.3B) account for $80.6B — 43% of all European inflows — and the mechanism is categorically different from what drives India or Mexico. Eurostat data shows the Swiss corridor alone accounts for approximately €21.3B of France's inflows, with Luxembourg adding roughly €8.6B. These are wages earned by French residents who commute across international borders daily to work in Switzerland or Luxembourg, then bring earnings home. Under World Bank and IMF balance-of-payments accounting, that compensation classifies as a remittance inflow to France. Ranking France alongside Bangladesh conflates two economically distinct phenomena: cross-border worker compensation in high-income labour markets versus diaspora households transferring savings to low-income family members. The United States, which sends over $100B abroad annually as the world's largest remittance sender, itself appears as a $9.0B recipient at rank 24 — the same cross-border worker dynamic, this time involving US residents commuting to Canada or Mexico. Europe's aggregate figure is largely incomparable with those of developing regions, and treating them equivalently inflates Europe's apparent share of a flow whose development-finance significance is concentrated elsewhere.
Egypt's Policy-Driven Surge and What It Reveals
Egypt's rise to fourth globally with $41.5B is one of the most instructive data points in the 2025 dataset. The increase is directly attributable to the Central Bank of Egypt's March 2024 shift to a flexible exchange rate. By closing the gap between official and parallel market rates, formal banking channels became price-competitive with informal hawala networks, unlocking billions in transfers from Gulf-based Egyptian workers that previously bypassed the banking system. This mirrors a recurring pattern: when Bangladesh liberalised its exchange rate in 2022 and Pakistan did the same in 2023, both recorded sharp spikes in formal-channel inflows as the black-market premium disappeared. The implication is that official remittance statistics structurally undercount true flows wherever currency distortions persist, and that a single monetary policy decision can shift billions overnight without any change in underlying migration or wage reality.
Dependency Ratios: Where Absolute Numbers Mislead
The absolute ranking is a poor guide to economic exposure. Nigeria ($22.8B, rank 10) appears formidable in the treemap but represents only 4–5% of Nigerian GDP. Tajikistan ($10.2B, rank 21) receives approximately 48% of its GDP in remittances — the highest ratio globally. Over 1.2 million Tajiks, roughly 12% of the entire population, work in Russia, and their transfers function as the country's primary economic stabiliser. Honduras ($11.9B, rank 19) and El Salvador ($10.1B, rank 22) receive remittances equal to approximately 28% and 25% of their respective GDPs, making US immigration enforcement their de facto monetary policy. When enforcement reduces new migrant arrivals, neither country has an institutional mechanism to compensate for the lost foreign exchange.
Mexico's Q2 2025 data illustrates this fragility in real time. Inflows fell approximately 11% year-on-year — one of the sharpest policy-driven declines in a major corridor in over a decade — directly linked to reduced migrant arrivals suppressing the transfer base. This is structurally different from the demand-side shocks that caused brief remittance dips during the 2008–09 financial crisis and COVID-19, both of which reversed rapidly. An enforcement-driven supply disruption in the world's second-largest receiving country ($64.4B) has no automatic recovery mechanism.
The $804B headline also overstates what actually reaches recipient households. IFAD and World Bank data show that sending $200 to Sub-Saharan Africa costs approximately 7–8% on average — more than double the UN SDG target of 3%. Nigeria's $22.8B and smaller African flows are subject to the world's highest corridor costs, meaning the development impact per dollar is materially lower than gross figures suggest.
As global remittances cross $800B for the first time, the dataset captures a system under simultaneous pressure from US immigration enforcement reshaping the Mexico corridor, exchange-rate policy in major recipient countries unlocking previously invisible flows, and methodological debates about whether European cross-border worker compensation should count alongside diaspora transfers at all. How those three forces interact over the next 12 months will determine whether 2025 marks a structural inflection or a temporary peak.
One chart like this in your inbox each week, explained in plain English — join the Everything Econ newsletter. Always free, and you can unsubscribe any time.
Take this one home
Get this visualisation as a download, wallpaper, or printed poster.
← Back to all visualisations & articles
Follow Everything Econ: YouTube · TikTok · X · Instagram · Facebook