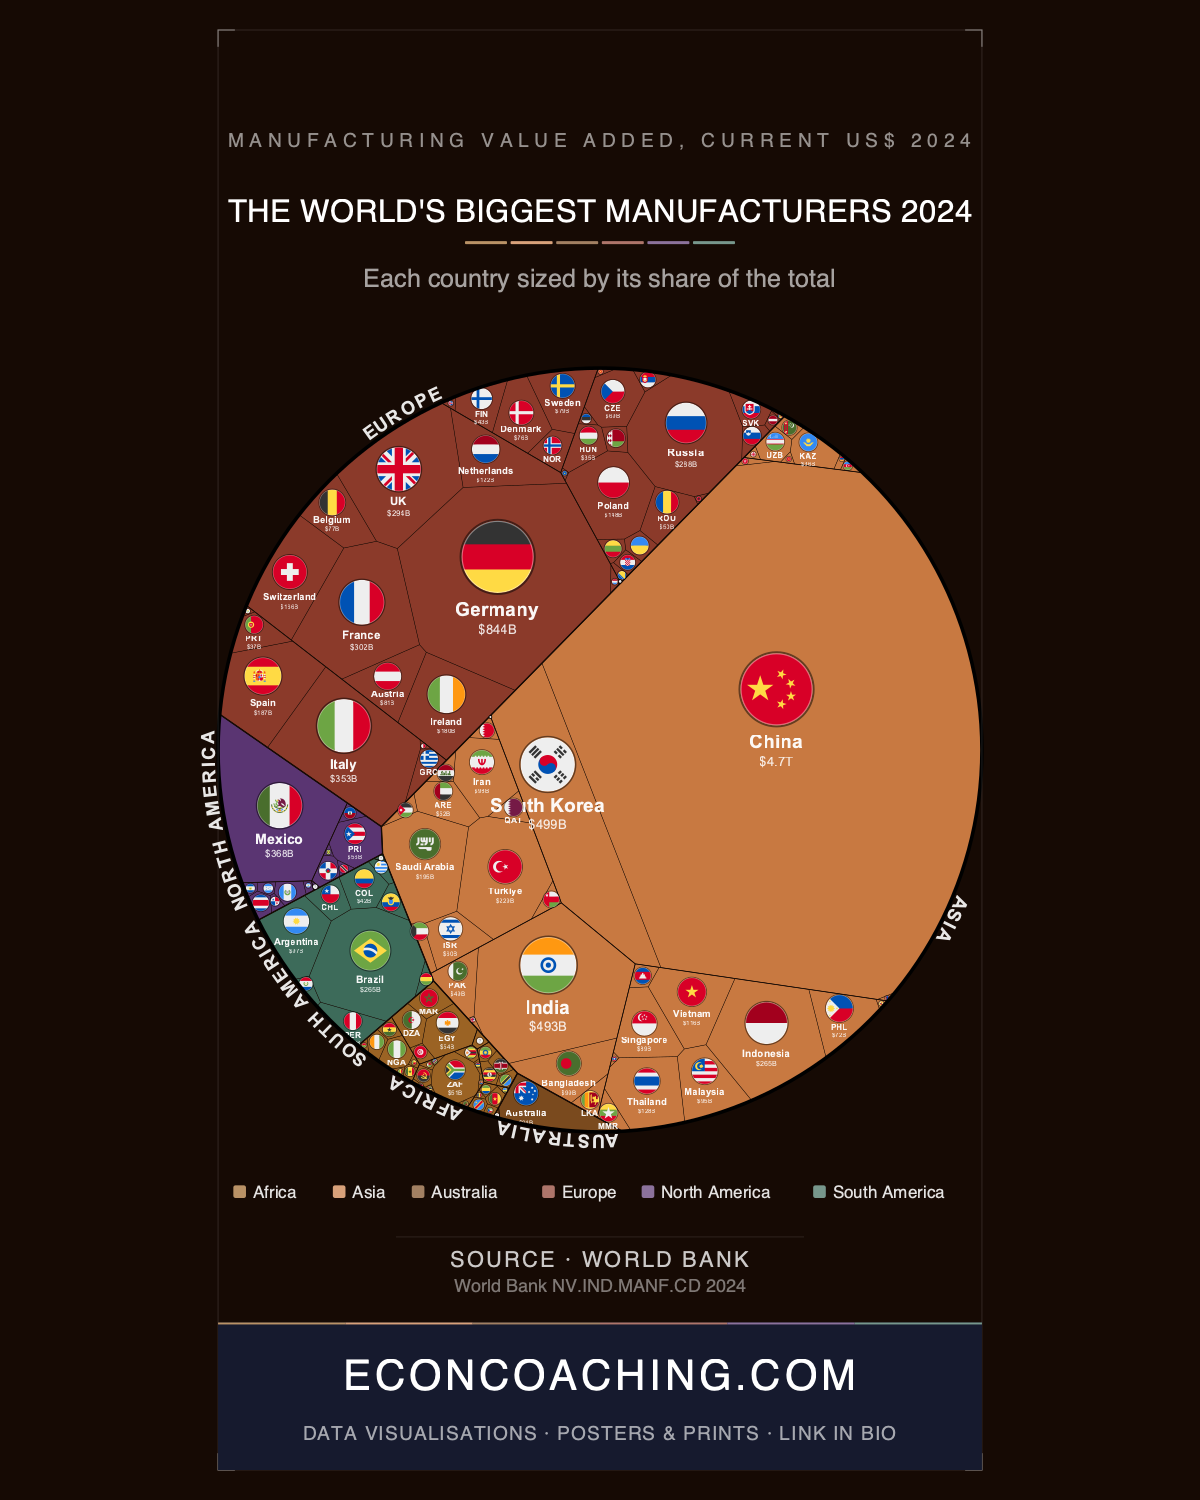
China produced $4.66 trillion in manufactured goods in 2024 — more than every European nation combined, including Germany, France, Italy, the United Kingdom, and 40-plus others that together reached only $3.61 trillion. The treemap accompanying this article makes that gap visible: China's rectangle consumes 37.52% of the entire chart, a single country's block dwarfing a continent's. China has held the global number one manufacturing position for 15 consecutive years, overtaking the United States around 2010 to end roughly a century of American industrial dominance.
One caveat applies to that 37.52% figure: this dataset covers 135 countries totalling approximately $12.42 trillion, and both the United States (estimated ~$2.9T) and Japan (~$1T) appear absent. Adding them raises the global total to roughly $16.3 trillion and reduces China's share to approximately 28.6% — consistent with the 28–30% range cited by the World Bank. The absolute comparison with Europe holds regardless of dataset scope.
Germany's Four-Year Contraction
Germany ranks second globally at $843.7 billion, but its position reflects structural erosion rather than strength. Industrial output has fallen for four consecutive years, dropping roughly 10% from its 2018 peak by 2024. Foreign direct investment into Germany roughly halved in 2024, and 42% of German industrial firms have indicated plans to invest abroad rather than expand domestically. The ifo Institute projects Germany could lose 1 million manufacturing jobs by 2030. The proximate cause is energy: Germany's industrial model was built on cheap Russian natural gas and dominant automotive and chemical exports — BASF alone operates the world's largest integrated chemical complex at Ludwigshafen, where energy is the primary cost input. Russia's invasion of Ukraine in 2022 broke that model. Volkswagen opened discussions in 2024 about domestic factory closures for the first time in its 87-year history, signalling that German manufacturers are not retooling at home but relocating.
Mexico Above France, Italy, and the UK
Mexico at $367.6 billion ranks fifth globally — ahead of Italy ($352.9B), France ($302.3B), and the United Kingdom ($294.3B), three G7 economies. That ranking reflects nearshoring-driven structural change: companies reducing dependence on Chinese production by adding capacity closer to the US market. Mexico recorded $31 billion in FDI in the first half of 2024 alone, produced 4 million vehicles (up 5.56% year-on-year), and secured confirmed EV plant commitments from BMW, Volkswagen, and BYD. The China Plus One strategy — maintaining Chinese capacity while adding a parallel site outside China — has made Mexico the primary beneficiary in the Americas, with Vietnam and India absorbing the equivalent shift in Asia.
India Closing on South Korea
South Korea ($499.2B) and India ($493.0B) are separated by just $6.2 billion — a gap of 1.24% — despite South Korea having a population of 52 million versus India's 1.4 billion. India's manufacturing output grew approximately 6% in 2024, and at that trajectory it could overtake South Korea within one to two years to become the world's third-largest manufacturer. The structural limitation is revealing: manufacturing accounts for only 16% of India's GDP, well short of the 25% target set under Make in India when the initiative launched in 2014. Manufacturing FDI grew 18% year-on-year to $19.04 billion in FY 2024–25, and India now produces roughly 25% of global iPhones. The base is expanding, but the GDP share indicates how far India remains from the manufacturing intensity China achieved at a comparable development stage.
Vietnam's Electronics Surge and Its Dependency Caveat
Vietnam ranks 20th at $116.4 billion, and electronics exports surged 27% in 2024 to $72.56 billion — one-third of the country's total export value. Samsung, Luxshare, and Apple suppliers have relocated significant capacity to Vietnam under China Plus One, producing a headline manufacturing boom. The structural caveat is significant: eight of Vietnam's ten fastest-growing import categories from China in 2024 were electronic components. A substantial share of Vietnam's manufacturing output represents Chinese-sourced assembly re-exported to Western markets, with domestic value added considerably lower than the headline figure implies. Indonesia ($265.1B, #10), Thailand ($128.1B, #18), and Vietnam together give Southeast Asia roughly 4.1% of this dataset — equal to all of South America's share, but with considerably stronger forward momentum as supply-chain diversification away from China continues.
Africa at 2.4%, Ireland at 15th
Africa's 54 nations account for just 2.4% of manufacturing output in this dataset, or $298.1 billion — approximately 35% of Germany's output alone, and only 1.66 times Ireland's despite Africa being home to 18% of the world's population. Africa's share of global manufacturing has actually declined from approximately 3% in the 1970s as East and Southeast Asia industrialised at a pace Africa could not match. UNIDO has documented Africa as the only major region where manufacturing's share of GDP has fallen over the past 50 years. Nigeria's dollar-denominated manufacturing value added dropped roughly 55% in 2024, though this reflects naira currency depreciation rather than physical output collapse.
At the opposite extreme sits Ireland (#15, $180.1B), a country of 5 million ranking above Switzerland (#16, $165.7B). That figure is largely a statistical artifact: pharmaceutical multinationals book global revenues through Irish entities for tax efficiency, inflating headline output. Ireland's own Central Bank prefers a Modified Domestic Demand metric that strips out these distortions, which tells a far more modest story about genuine domestic manufacturing depth.
The Pre-Tariff Baseline
The 2024 data captures the last full year before the April 2025 US-China tariff escalation — 145% tariffs announced that month — began actively reshaping the flows these numbers reflect. Three structural shifts are simultaneously at inflection points: Germany's deindustrialisation has extended to four consecutive years and is triggering capital flight; India is within months of overtaking South Korea to reach third globally; and Mexico's nearshoring momentum is rewriting North American supply chains faster than most forecasts anticipated. The 2025 data will show whether those trends accelerated or broke under the weight of new trade barriers.
One chart like this in your inbox each week, explained in plain English — join the Everything Econ newsletter. Always free, and you can unsubscribe any time.
Take this one home
Get this visualisation as a download, wallpaper, or printed poster.
← Back to all visualisations & articles
Follow Everything Econ: YouTube · TikTok · X · Instagram · Facebook