
Custom data visualisations, made simple
Send me your data — I’ll turn it into a clean, striking graphic designed around your brand. Clear fixed prices, fast turnaround, an instant quote in seconds.
How it works
From data to finished graphic in four simple steps.
1
Pick or quote
Choose a package, or get an instant price for your exact job.
2
Send your brief
Share your data, brand colours and any references.
3
Review
I send a preview; you request any tweaks within your revisions.
4
Delivered
Final files in the formats you need, ready to use.
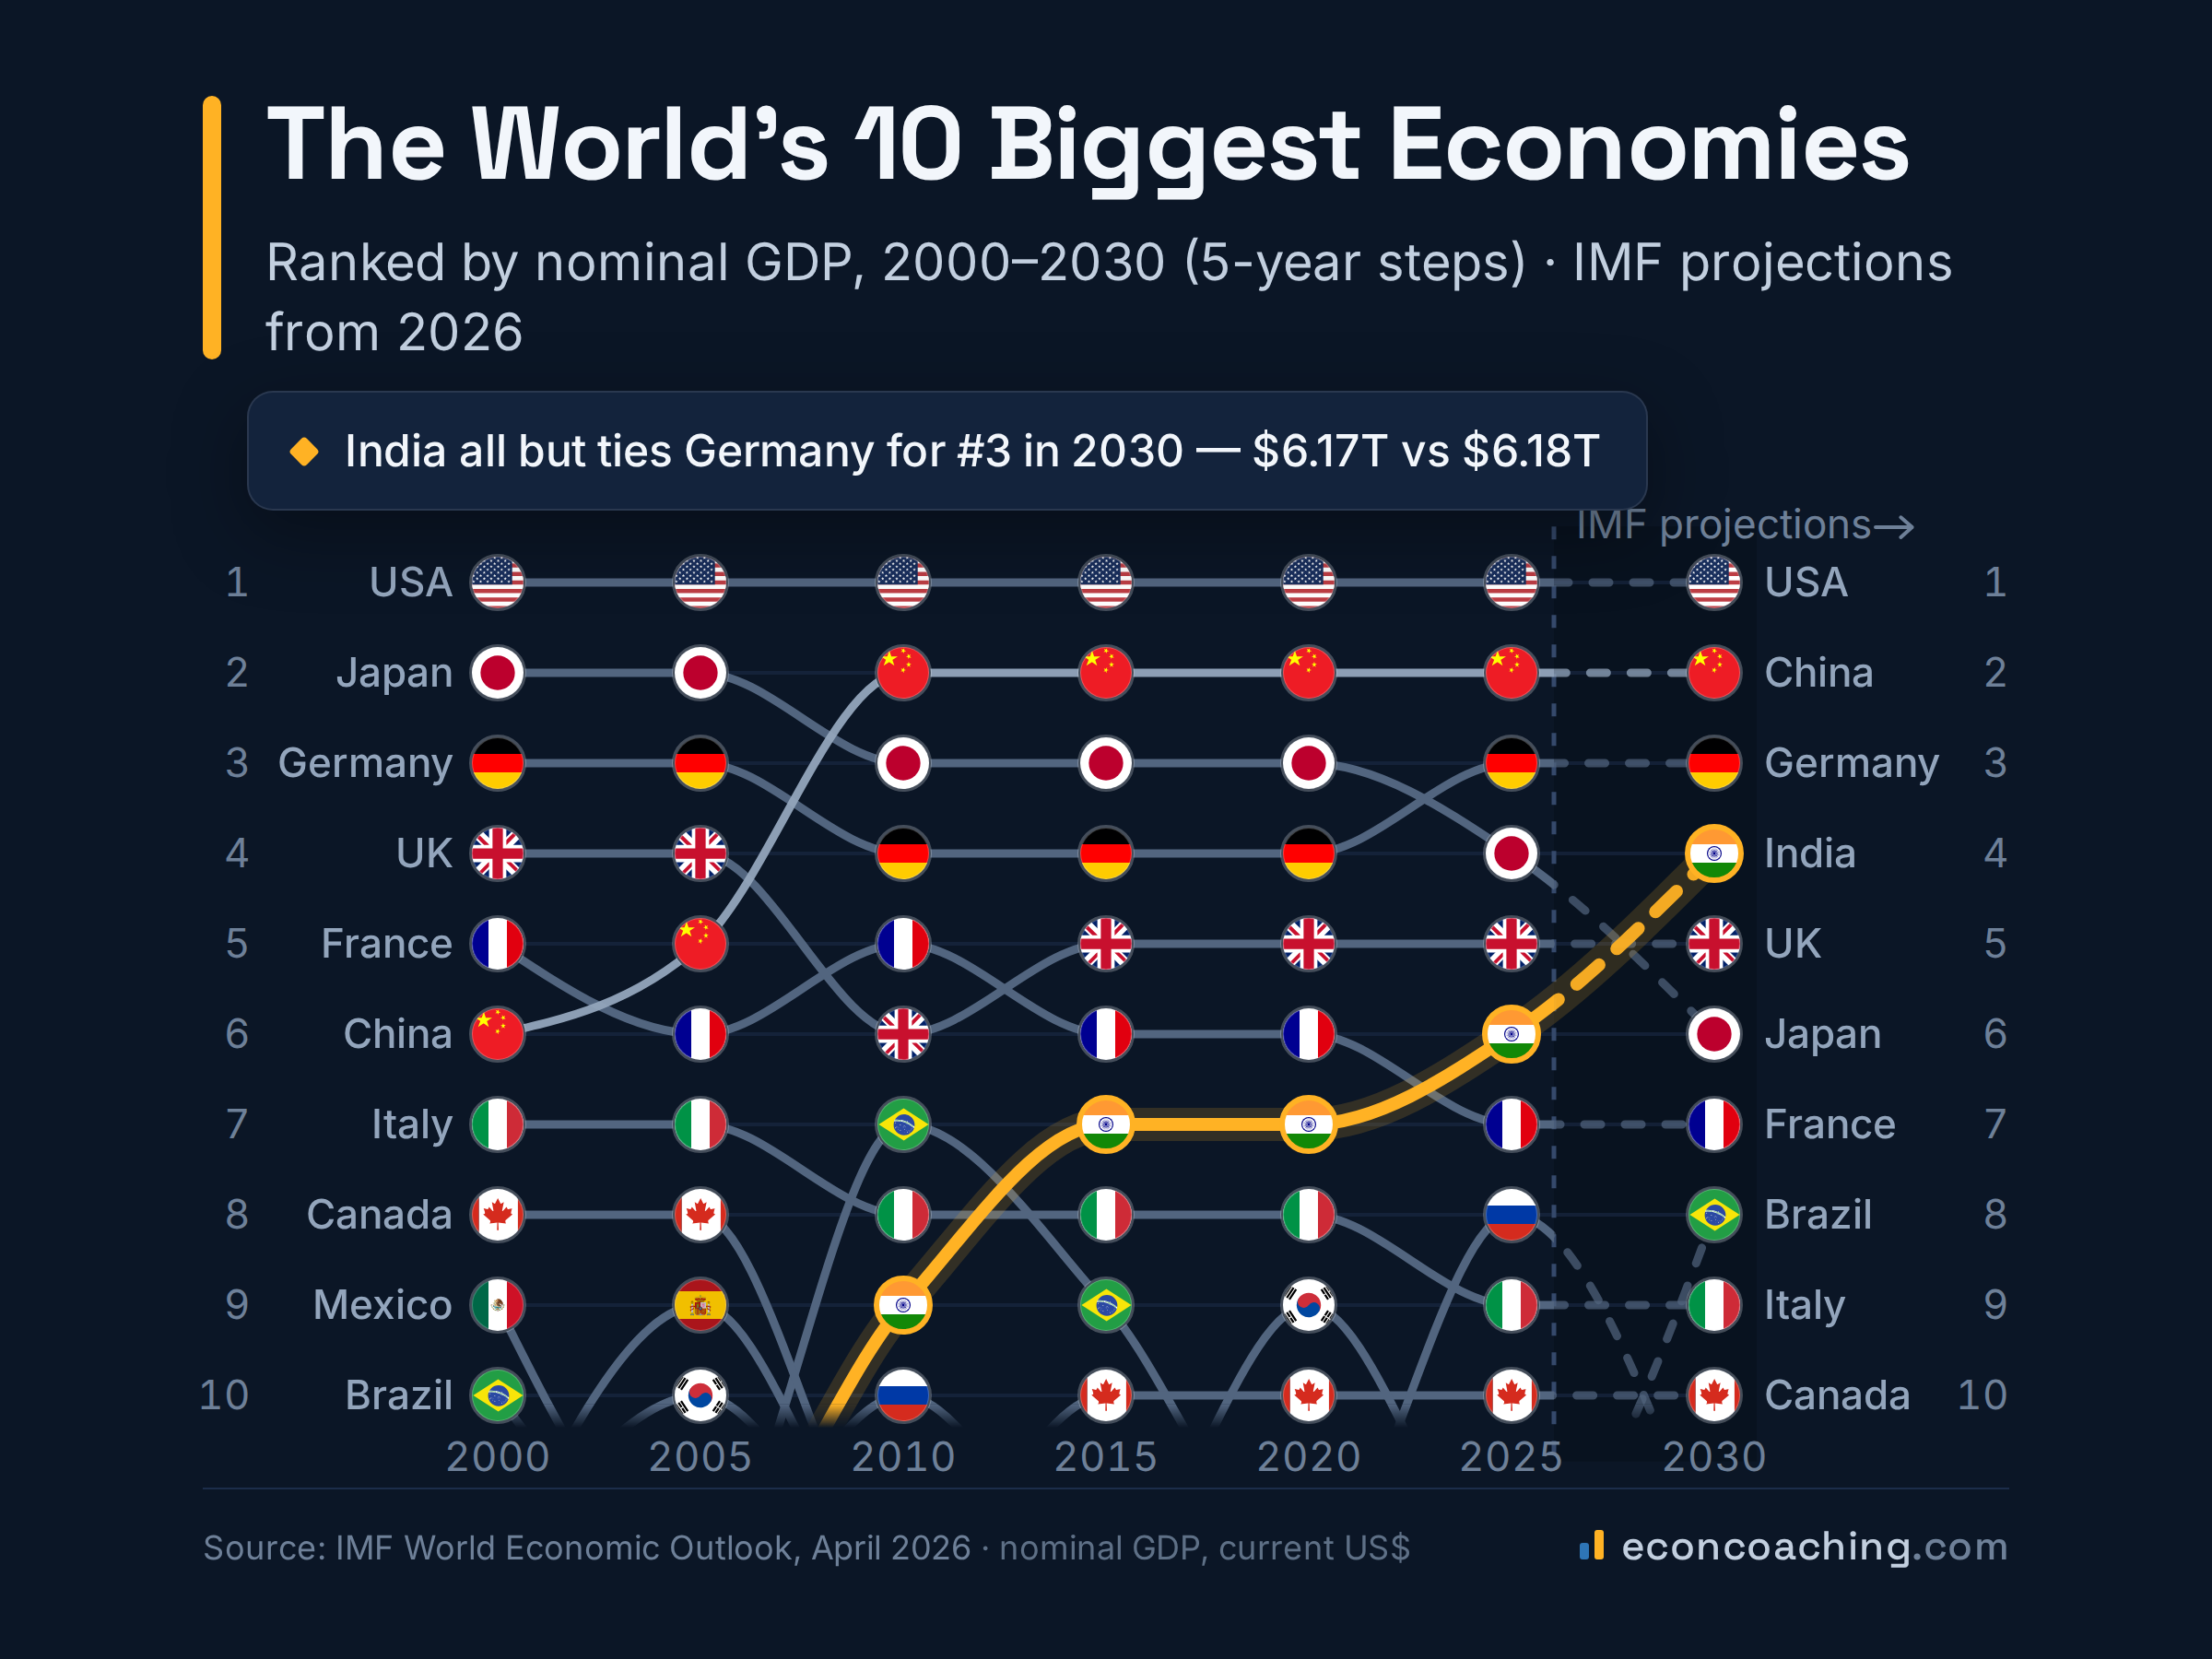
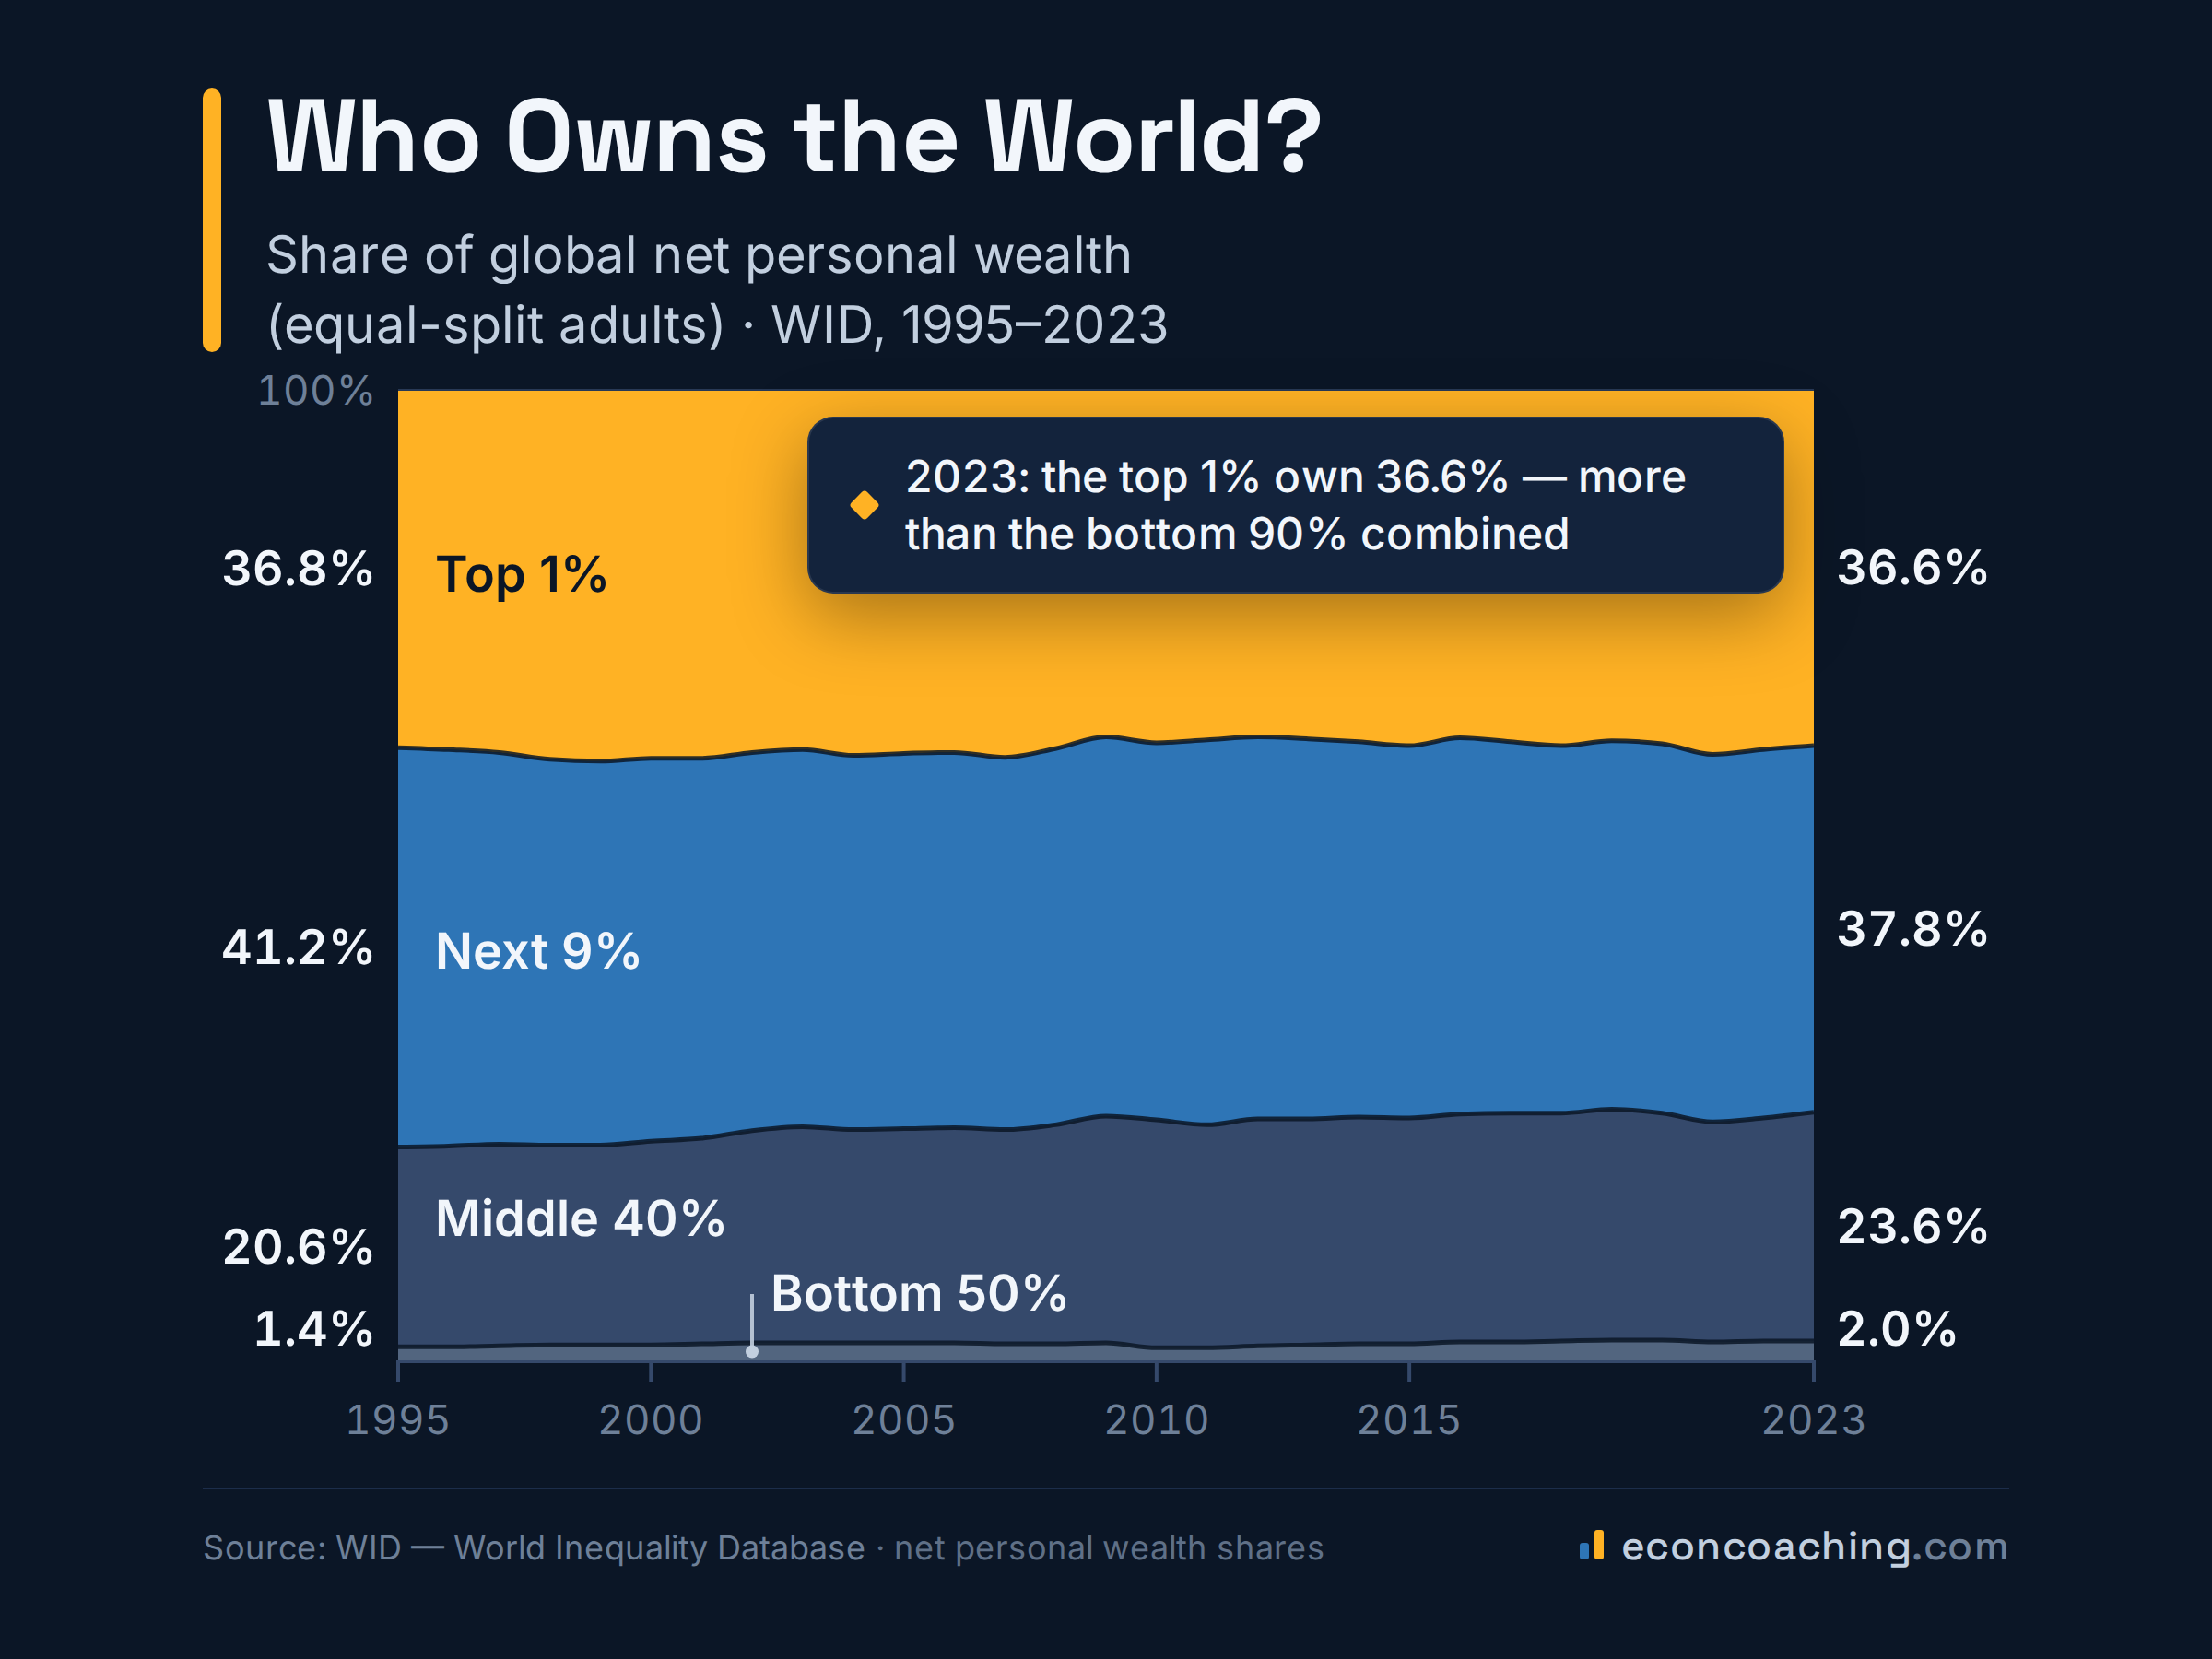
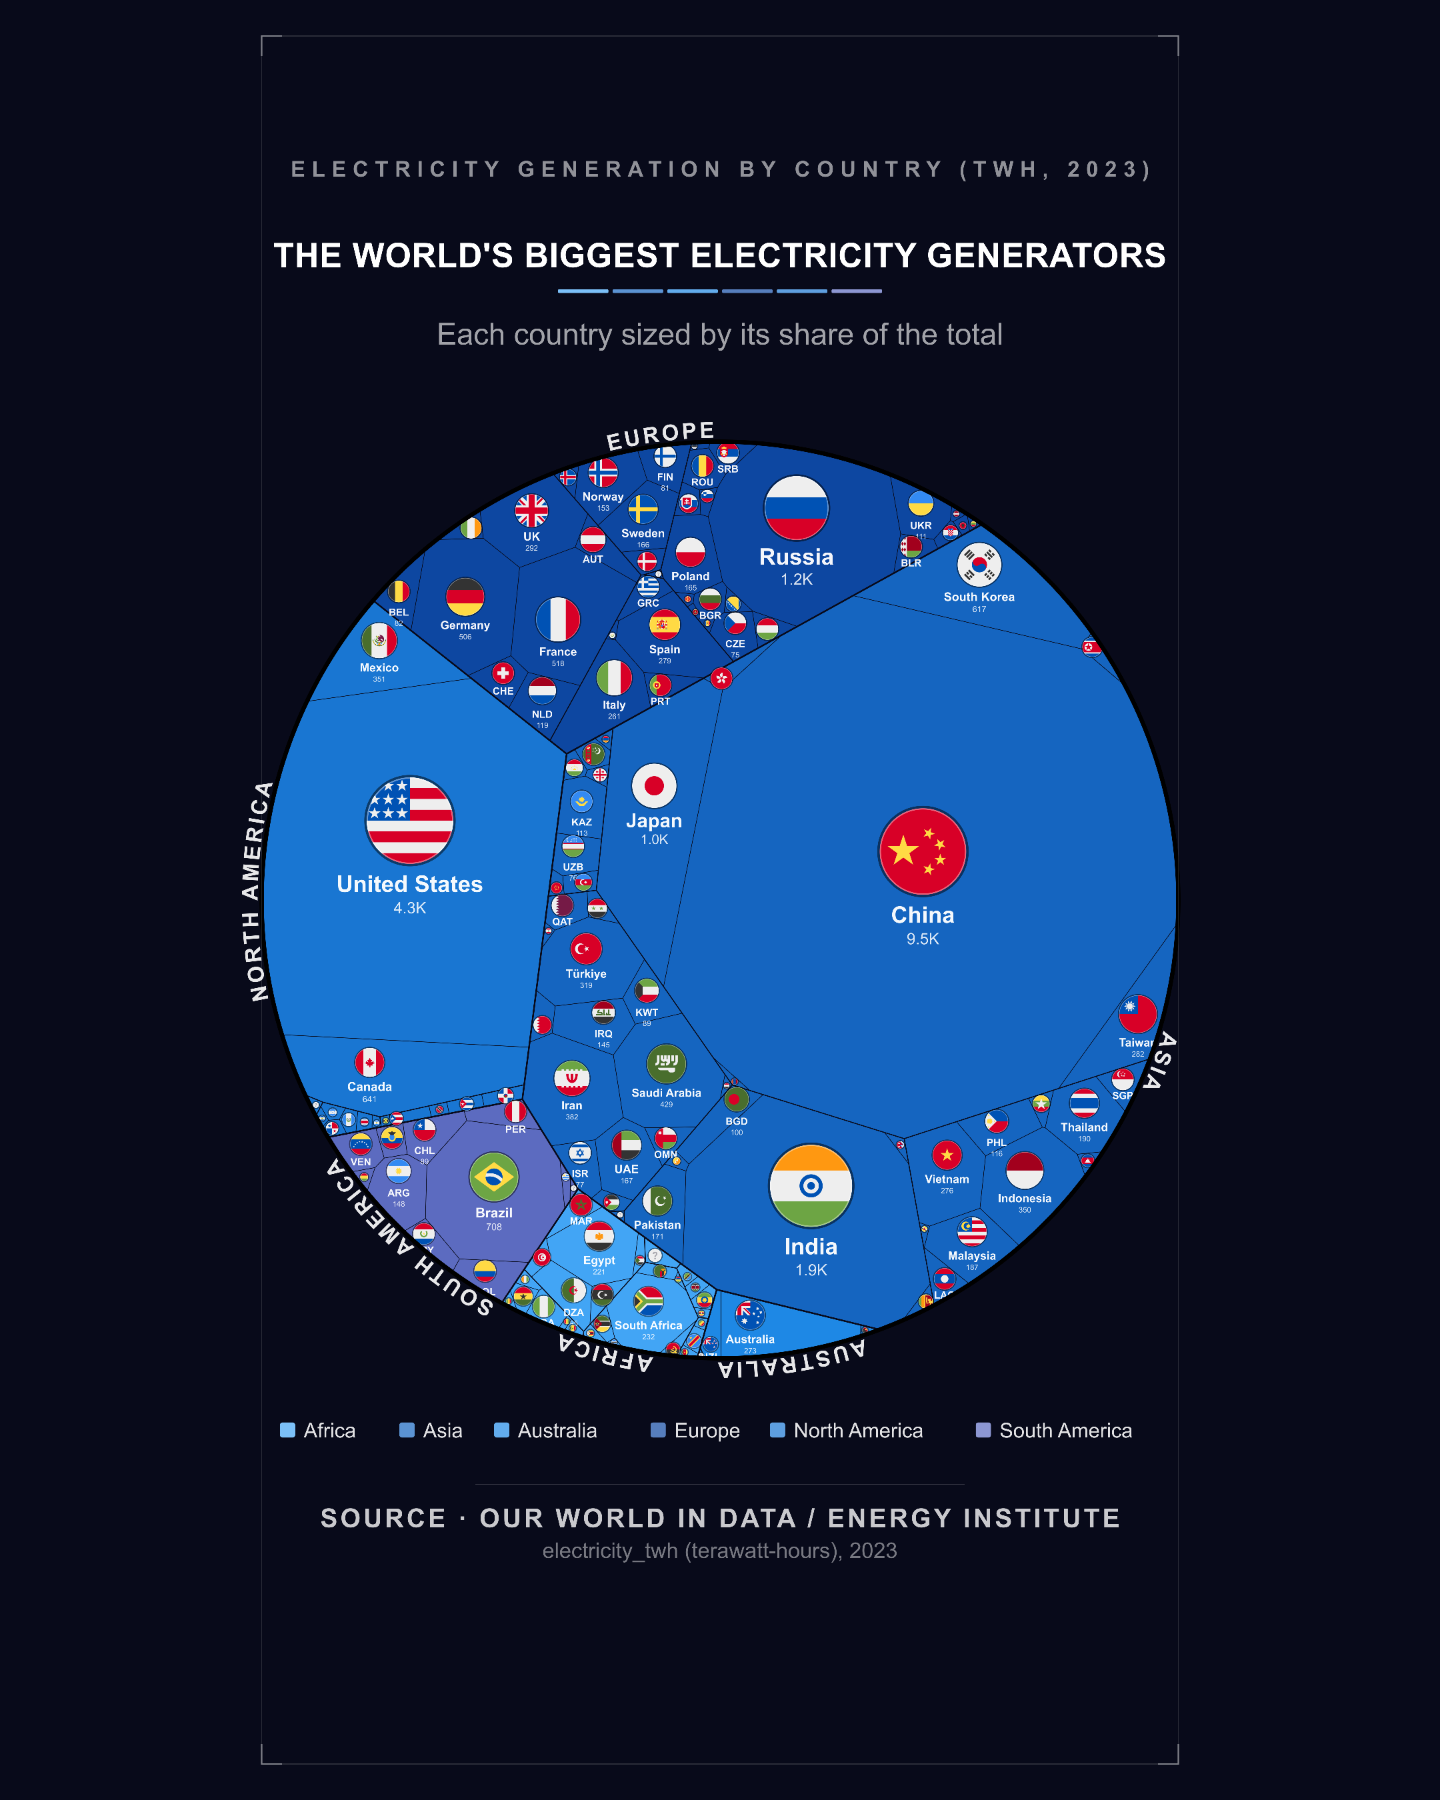
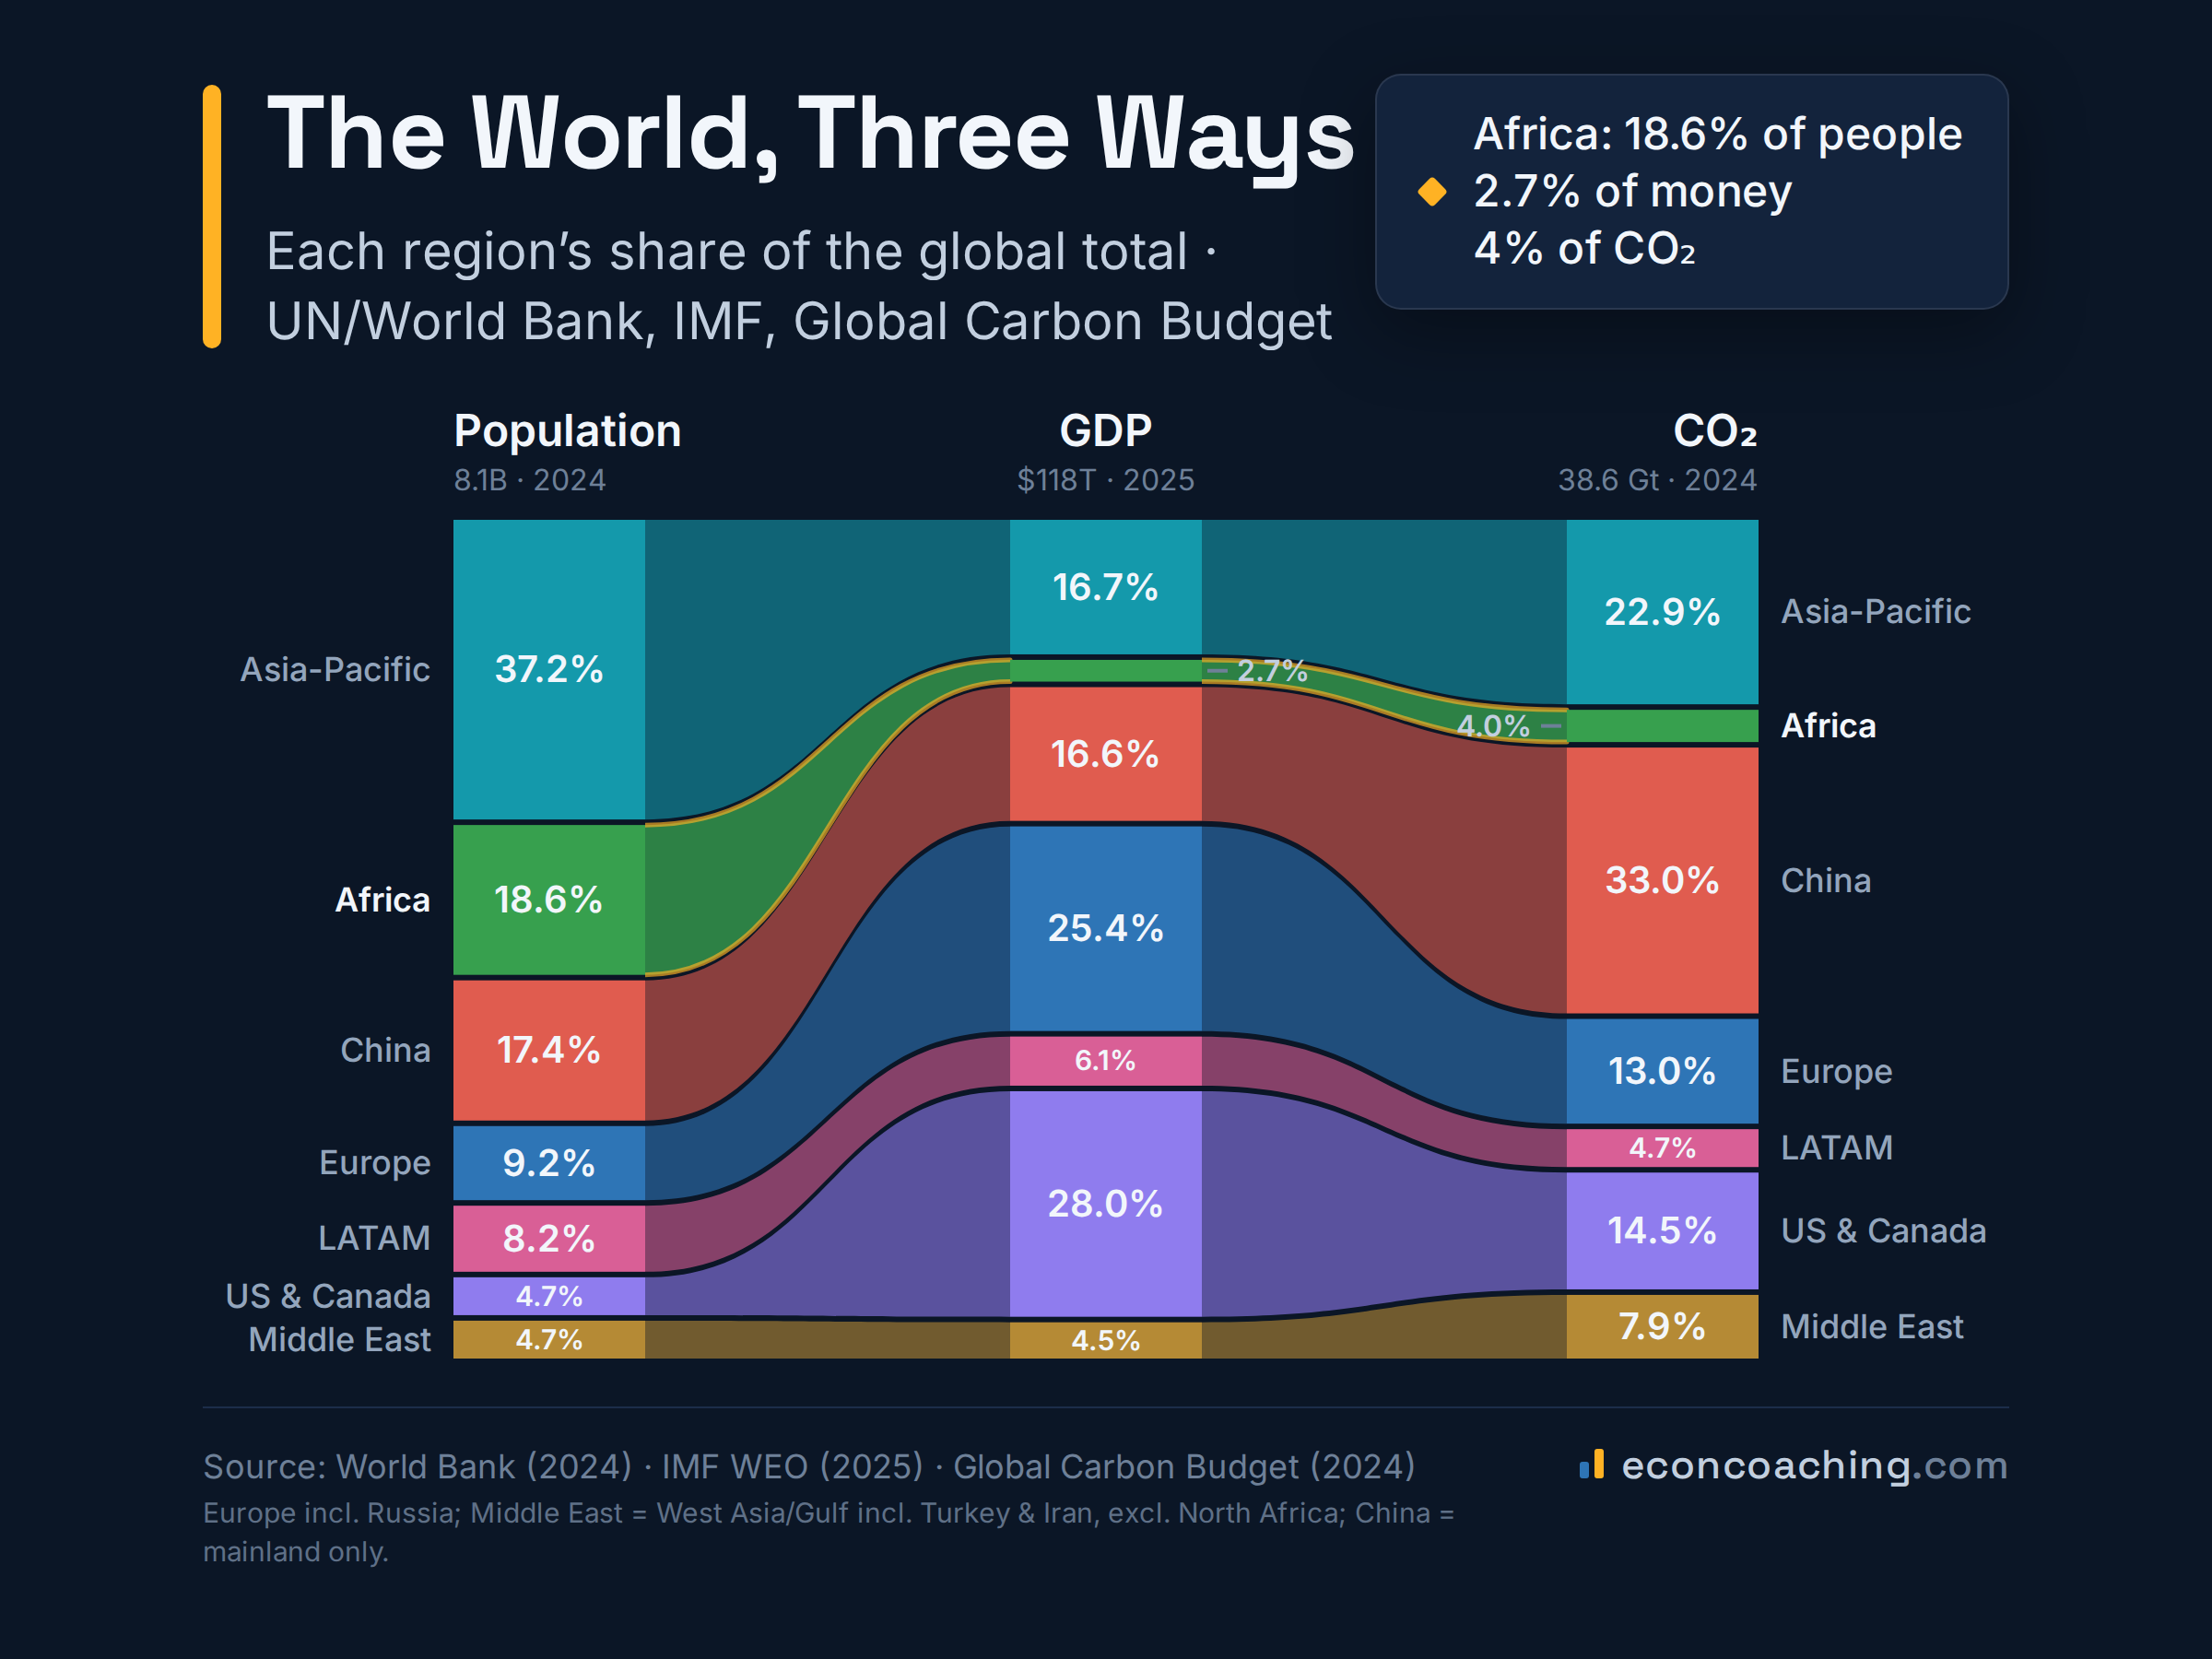
Example work
A few examples of what’s possible — from clean statistical charts to specialist graphics.


Popular packages
Fixed scope, fixed price — buy in a couple of clicks.
Statistical & chart graphics
From £35
- Bar, line, scatter, pie, distribution charts
- Designed to your brand
- PNG / SVG / PDF, source files on Premium
Network, Voronoi & specialist
From £65
- Voronoi, network/force graphs, treemaps
- Eye-catching, presentation-ready
- PNG / SVG / PDF, source files on Premium
Ready to see your data come to life?
Get a price in seconds — no obligation.