
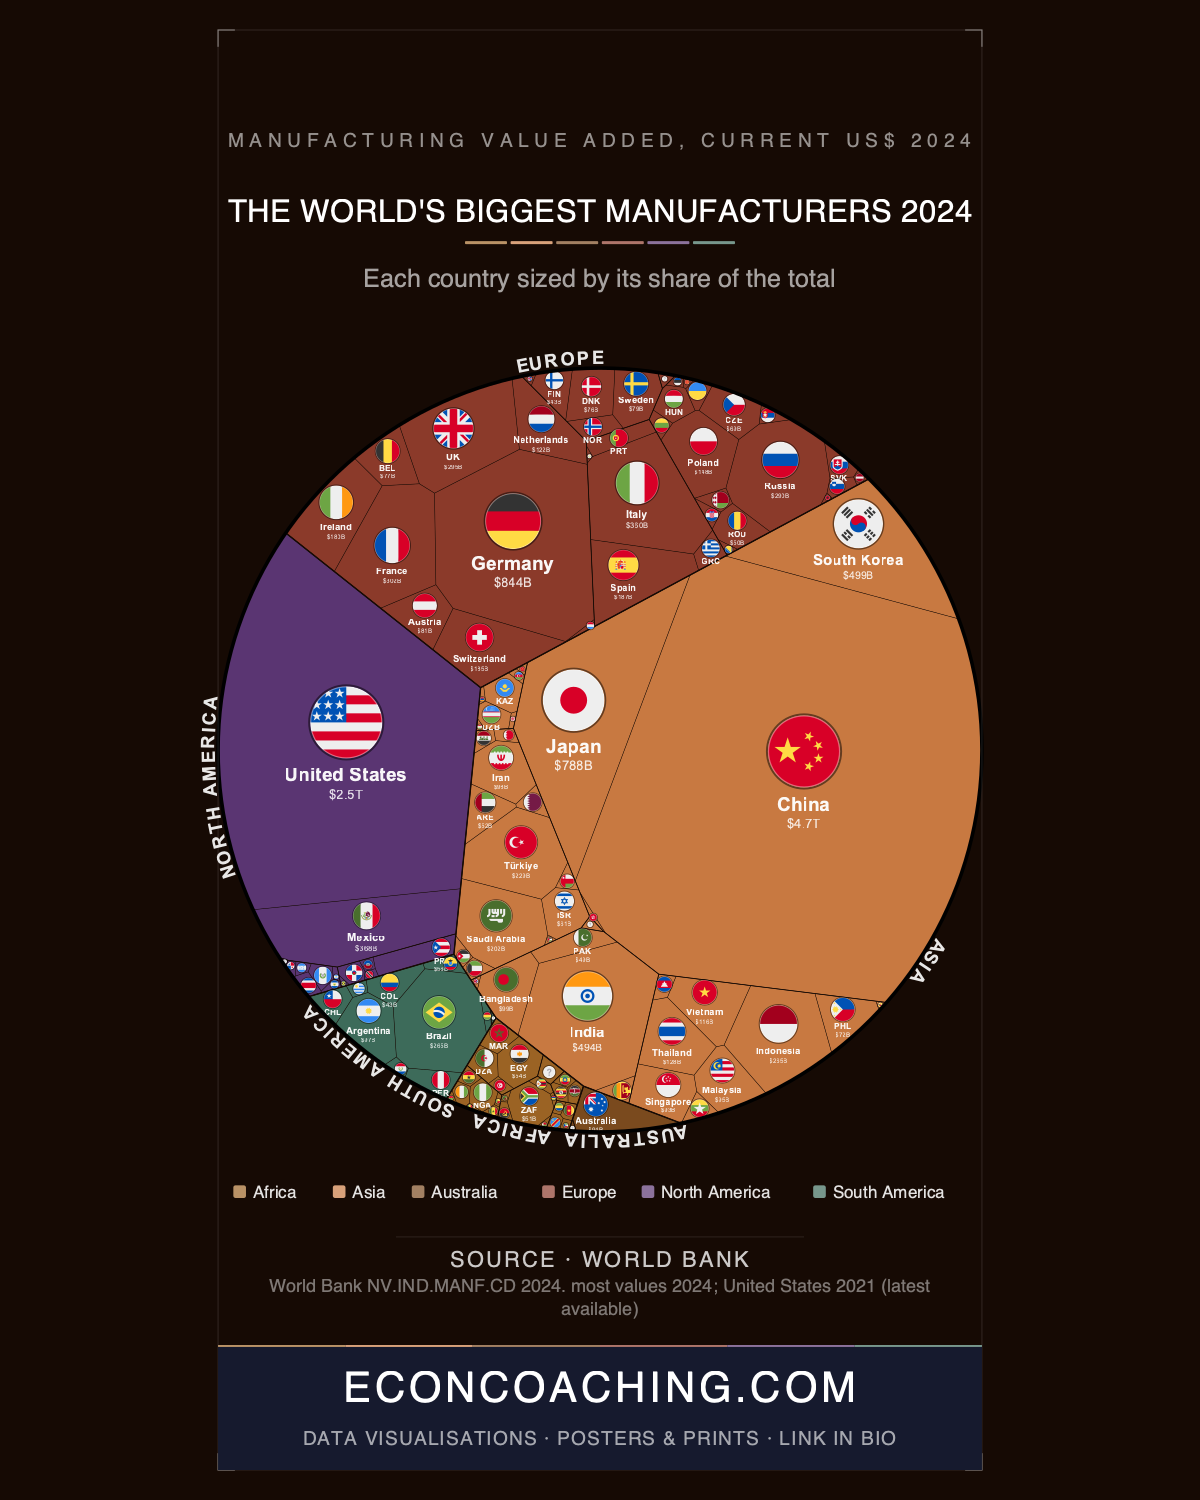
China's manufacturing output in 2024 reached $4.66 trillion, more than the entire European continent's $3.61 trillion combined, a continent that spans more than 40 countries. In the treemap accompanying this article, where each cell's area represents output rather than land mass, China occupies a rectangle larger than every European nation stacked together, from Germany down to the smallest producers. China has held the position of the world's largest manufacturer for 15 consecutive years as of 2024, and this dataset shows how wide that gap has become.
China's Scale, and the Denominator Behind the Percentage
China's $4.66 trillion accounts for 37.52% of the 135-country dataset behind this analysis, a dataset totalling roughly $12.42 trillion. That share needs a caveat: the United States and Japan do not appear in it. Adding an estimated $2.9 trillion for the US and $1 trillion for Japan would lift the global total to roughly $16.3 trillion and pull China's share down to approximately 28.6%, closer to the 28-30% range cited by the World Bank and other major sources. Either way, the comparison against Europe holds: a single country outproduces an entire continent that includes three of the world's top ten manufacturers in Germany, Italy, and France.
Germany's Four-Year Contraction
Germany still ranks second globally at $843.7 billion, well ahead of every other European economy, but the trend line is the story. German industrial output has fallen for four consecutive years, down roughly 10% from its 2018 peak by 2024. Foreign direct investment into Germany roughly halved in 2024, and 42% of German industry now says it plans to invest abroad rather than at home. The ifo Institute projects Germany could lose 1 million manufacturing jobs by 2030. Germany built its postwar industrial base on cheap Russian natural gas feeding its auto and chemical sectors; the 2022 energy crisis that followed Russia's invasion of Ukraine removed that cost advantage and accelerated a contraction that was already under way.
South Korea and India's Statistical Photo Finish
South Korea ranks third at $499.2 billion and India fourth at $493.0 billion, a gap of just $6.2 billion, or 1.24%. The populations behind those figures could not be more different: South Korea has around 52 million people, India close to 1.4 billion. India's manufacturing output grew approximately 6% in 2024, and at that rate it could overtake South Korea within one to two years. Yet manufacturing still accounts for only about 16% of India's GDP, short of the 25% target set under the Make in India initiative launched in 2014. Manufacturing FDI into India grew 18% year-on-year to $19.04 billion in FY 2024-25, and the country now produces roughly a quarter of the world's iPhones, evidence the sector is deepening even as the GDP-share target stays out of reach.
Mexico's Boom, Ireland's Mirage, Vietnam's Assembly Surge
Mexico ranks fifth at $367.6 billion, ahead of Italy, France, and the United Kingdom, on the strength of nearshoring. It recorded $31 billion in FDI in the first half of 2024, built 4 million vehicles (up 5.56% year-on-year), and secured new EV plant commitments from BMW, Volkswagen, and BYD. Ireland ranks 15th at $180.1 billion, ahead of Switzerland's $165.7 billion, despite a population of just 5 million. That ranking is largely a function of pharmaceutical multinationals booking global output through Irish entities for tax purposes rather than genuine domestic manufacturing depth, which is why the Central Bank of Ireland prefers its Modified Domestic Demand measure instead. Vietnam, ranked 20th at $116.4 billion, saw electronics exports surge 27% in 2024 to $72.56 billion, a third of the country's total exports, as Samsung, Luxshare, and Apple suppliers shifted capacity out of China under the China Plus One strategy. Eight of Vietnam's ten fastest-growing import categories from China in 2024 were electronic components, meaning a meaningful share of that output is Chinese-sourced assembly passing through Vietnam rather than domestically generated value.
Africa's Shrinking Share and the Regional Fringes
Africa's 54 nations together account for just 2.4% of this dataset, $298.1 billion, about 35% of Germany's output alone and only 1.66 times Ireland's total, despite holding roughly 18% of the world's population. That share has fallen from around 3% in the 1970s: Africa's absolute manufacturing base has grown while its relative position has worsened as Asia industrialised faster. Within the continent the direction diverges. South Africa's manufacturing expanded 4% in 2024 to $51.3 billion on improved electricity supply and stronger chemical and automotive exports, while Nigeria's dollar-denominated manufacturing value added fell approximately 55%, driven almost entirely by naira depreciation rather than an actual output collapse. Southeast Asia, combining Indonesia's $265.1 billion, Thailand's $128.1 billion, and Vietnam's $116.4 billion, reaches roughly 4.1% of the dataset, matching all of South America's 4.1% share. Brazil at $264.7 billion is South America's only top-20 manufacturer, and its nearest rival, Argentina at $96.9 billion, produces just 36.6% of Brazil's total after years of economic crisis. Australia, at $94.5 billion, accounts for essentially the whole of Oceania's 0.8% share on its own.
The 2024 figures represent the last full-year baseline before the 145% US-China tariffs announced in April 2025 began actively rerouting supply chains, which makes this dataset a reference point rather than a settled picture. India's approach to South Korea's manufacturing rank, Germany's fourth straight year of decline, and Mexico's nearshoring gains are each still in motion, and the next full-year dataset will show whether 2025's tariff shock accelerated or disrupted these trajectories.
For more data-driven analysis of global economics and the trends reshaping the world economy, visit econcoaching.com.
Take this one home
Get this visualisation as a download, wallpaper, or printed poster.
← Back to all visualisations & articles
Follow Everything Econ: YouTube · TikTok · X · Instagram · Facebook