
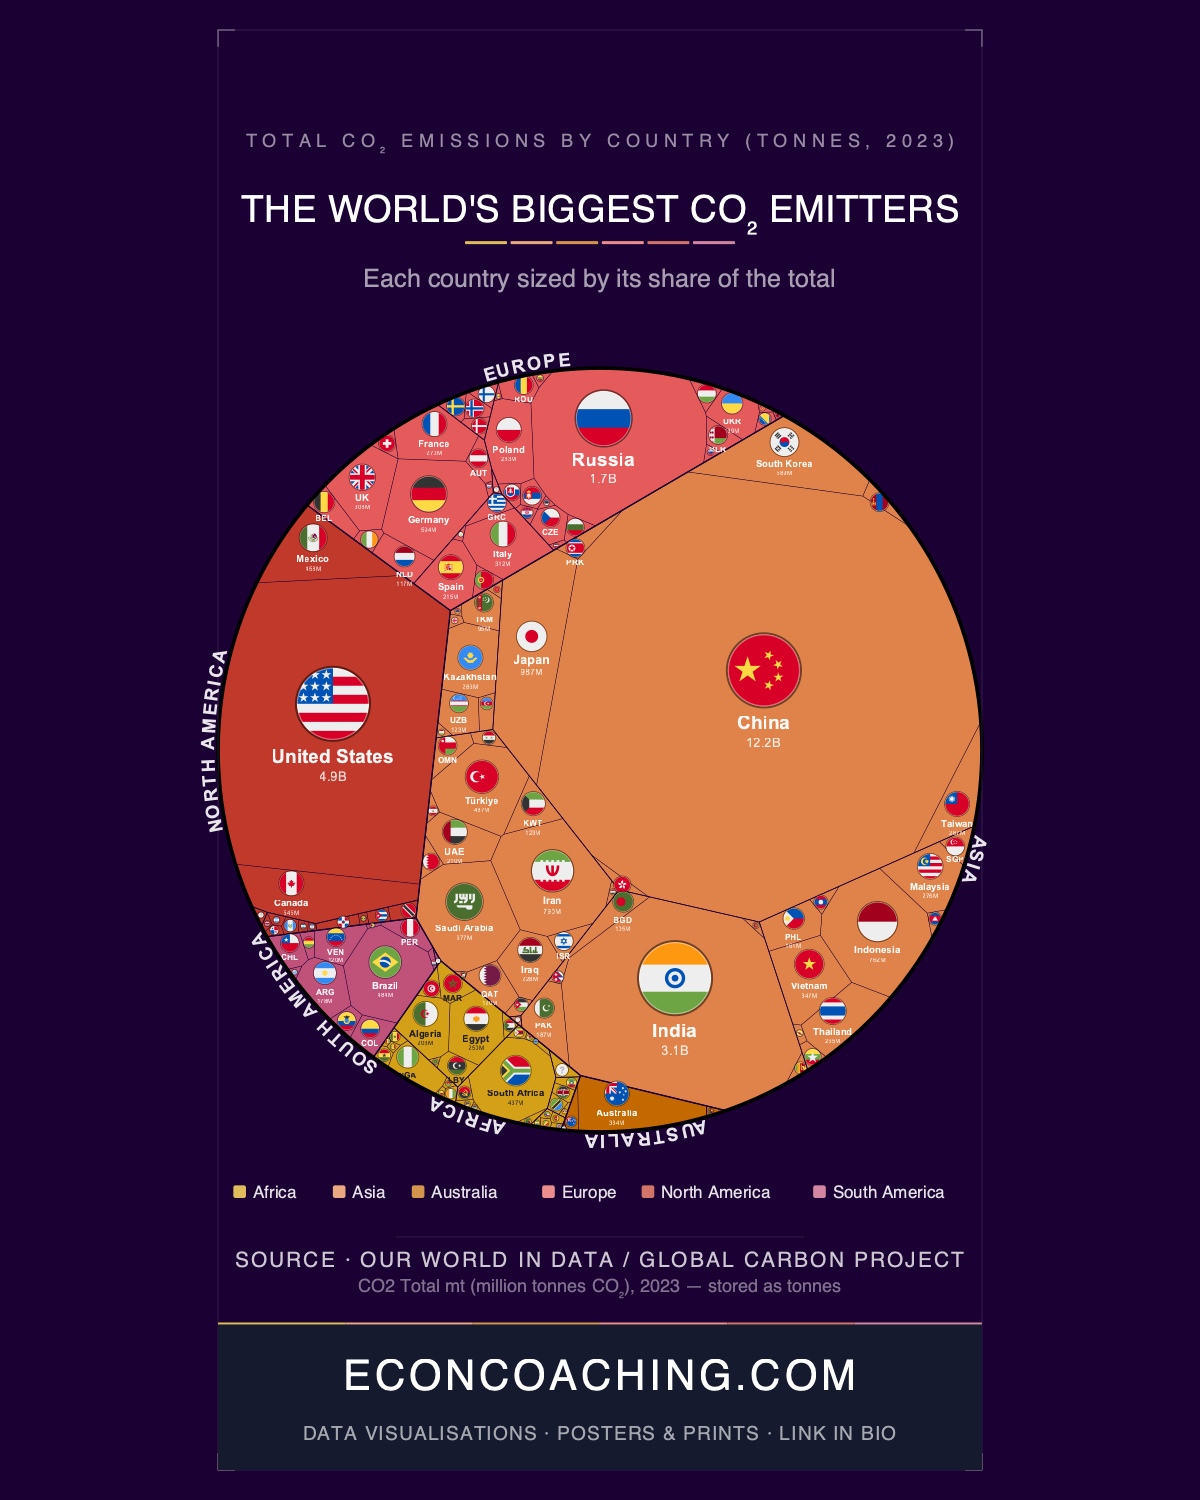
The treemap accompanying this article makes one fact impossible to ignore: China's rectangle is larger than the next four countries combined. At 12.17 gigatonnes — 32.91% of all global CO₂ in 2023 — China's block dwarfs the United States (13.30%), India (8.28%), Russia (4.69%), and Japan (2.67%) stacked together. Without China's 4% emissions growth in 2023, global totals would have remained roughly flat at 2022 levels. Every other trend in the data — the EU's historic decline, India's rise, advanced economies falling to 1973 levels — unfolds against that single, structurally dominant fact.
China: Record Emissions and Record Clean Energy, Simultaneously
In 1990, China and the United States contributed roughly equal shares of global CO₂. By 2023, China's share is more than double America's. Three decades of coal-powered manufacturing growth produced that divergence, and the coal dependency remains extreme: China alone accounts for over 50% of all global CO₂ emissions from coal combustion, emitting approximately 8.55 gigatonnes from coal — more than four times India's 2.03 Gt coal figure.
The counterintuitive layer is that China simultaneously accounted for around 60% of global additions of solar PV, wind power, and electric vehicles in 2023, according to the International Energy Agency. China is both the world's largest clean energy deployer and its largest polluter, which tells you that an energy transition and fossil fuel growth are not yet mutually exclusive. On a consumption-based accounting — where emissions are attributed to where goods are consumed rather than where they are manufactured — the gap between China and the United States narrows significantly. But on territorial emissions, the numbers in 2023 are unambiguous.
India's Ascent and the Equity Paradox
India's block in the treemap is the third largest, having surpassed the European Union in 2023 to reach 3.06 Gt. Two decades ago, India's share of global emissions was under 4%; it has now more than doubled. The milestone of overtaking the EU — a bloc of 27 countries — would have seemed implausible in the early 2000s.
India's per-capita emissions remain approximately 2.2 tonnes per year, roughly half the 4.7-tonne global average and a fraction of Australia's 14 tonnes or the US figure. That equity argument is real: India's citizens individually consume far less carbon than their counterparts in wealthy nations. But per-capita framing has its limits. India's 1.4 billion people collectively now contribute more to annual absolute emissions growth than any other country, which creates a genuine climate scaling problem regardless of how the historical responsibility debate is resolved. With COP30 approaching in Belém in 2025, India's position — third-largest total emitter, fraction of the per-capita average — sits at the centre of the most contested geopolitical argument in climate negotiations.
Advanced Economies: Decoupling GDP From Emissions
The EU's 2023 performance is the sharpest counter-signal in the data. Emissions fell 8% in a single year, driven by record renewables expansion and a collapse in coal use, reaching levels unseen since the early 1960s according to the European Environment Agency. The broader advanced economy picture is similarly striking: after falling approximately 4.5% in 2023, the combined CO₂ output of the US, EU, Japan, and peers fell below 1973 levels — while their GDP grew 1.7% that same year. That is the largest percentage emissions drop outside a recession on record, and it marks a genuine structural decoupling of economic output from carbon intensity. It does not, however, offset the volumes being added elsewhere.
Vietnam, Africa, and the Scale Problem at the Margins
Vietnam's 14.8% year-on-year surge — from approximately 325 Mt to 373 Mt — makes it one of the fastest-growing large emitters in 2023, driven by coal-fired industrialisation. Since 1990, Vietnam's emissions have grown roughly 19-fold from just 19 Mt, the fastest sustained trajectory of any country now approaching the top 20. It represents a category of economy — manufacturing-intensive, coal-dependent, rapidly developing — that China itself occupied thirty years ago.
Africa as a whole produced just 4.0% of global CO₂ in 2023, or 1.48 gigatonnes across 54 countries and 1.4 billion people. The entire continent emits less than China's annual increase alone. South Africa at 436.6 Mt is Africa's dominant emitter, producing more than Egypt (250 Mt) and Algeria (203 Mt) combined, reflecting extreme coal dependence relative to its regional peers. The equity dimension here is stark: Africa bears disproportionate climate risk — in food security, water stress, and extreme weather — while contributing a negligible share of cumulative or current emissions.
Brazil's fossil CO₂ ranking of 484 Mt significantly understates its true climate footprint. When land-use change and deforestation are included, as tracked by SEEG, Brazil's total GHG output is substantially higher — making the fossil-only figure misleading for policy purposes. A 24% drop in deforestation emissions in 2023 did help cut Brazil's overall greenhouse gas output by roughly 12% versus 2022, which is meaningful progress, but it depends on sustained enforcement rather than structural economic change.
Where the Data Points
The 2023 record of 36.99 Gt is the product of two opposite trends locked in the same global total: advanced economies achieving genuine decoupling for the first time outside a recession, while Asia — at 62.2% of global CO₂ — continues expanding its structural dominance of the emissions ledger. Whether the former can scale fast enough, and whether the latter can replicate decoupling before cumulative concentrations cross critical thresholds, is the central quantitative question heading into the next decade of climate negotiations.
For more data-driven analysis of global economics and the trends reshaping the world economy, visit econcoaching.com.
Take this one home
Get this visualisation as a download, wallpaper, or printed poster.
← Back to all visualisations & articles
Follow Everything Econ: YouTube · TikTok · X · Instagram · Facebook