
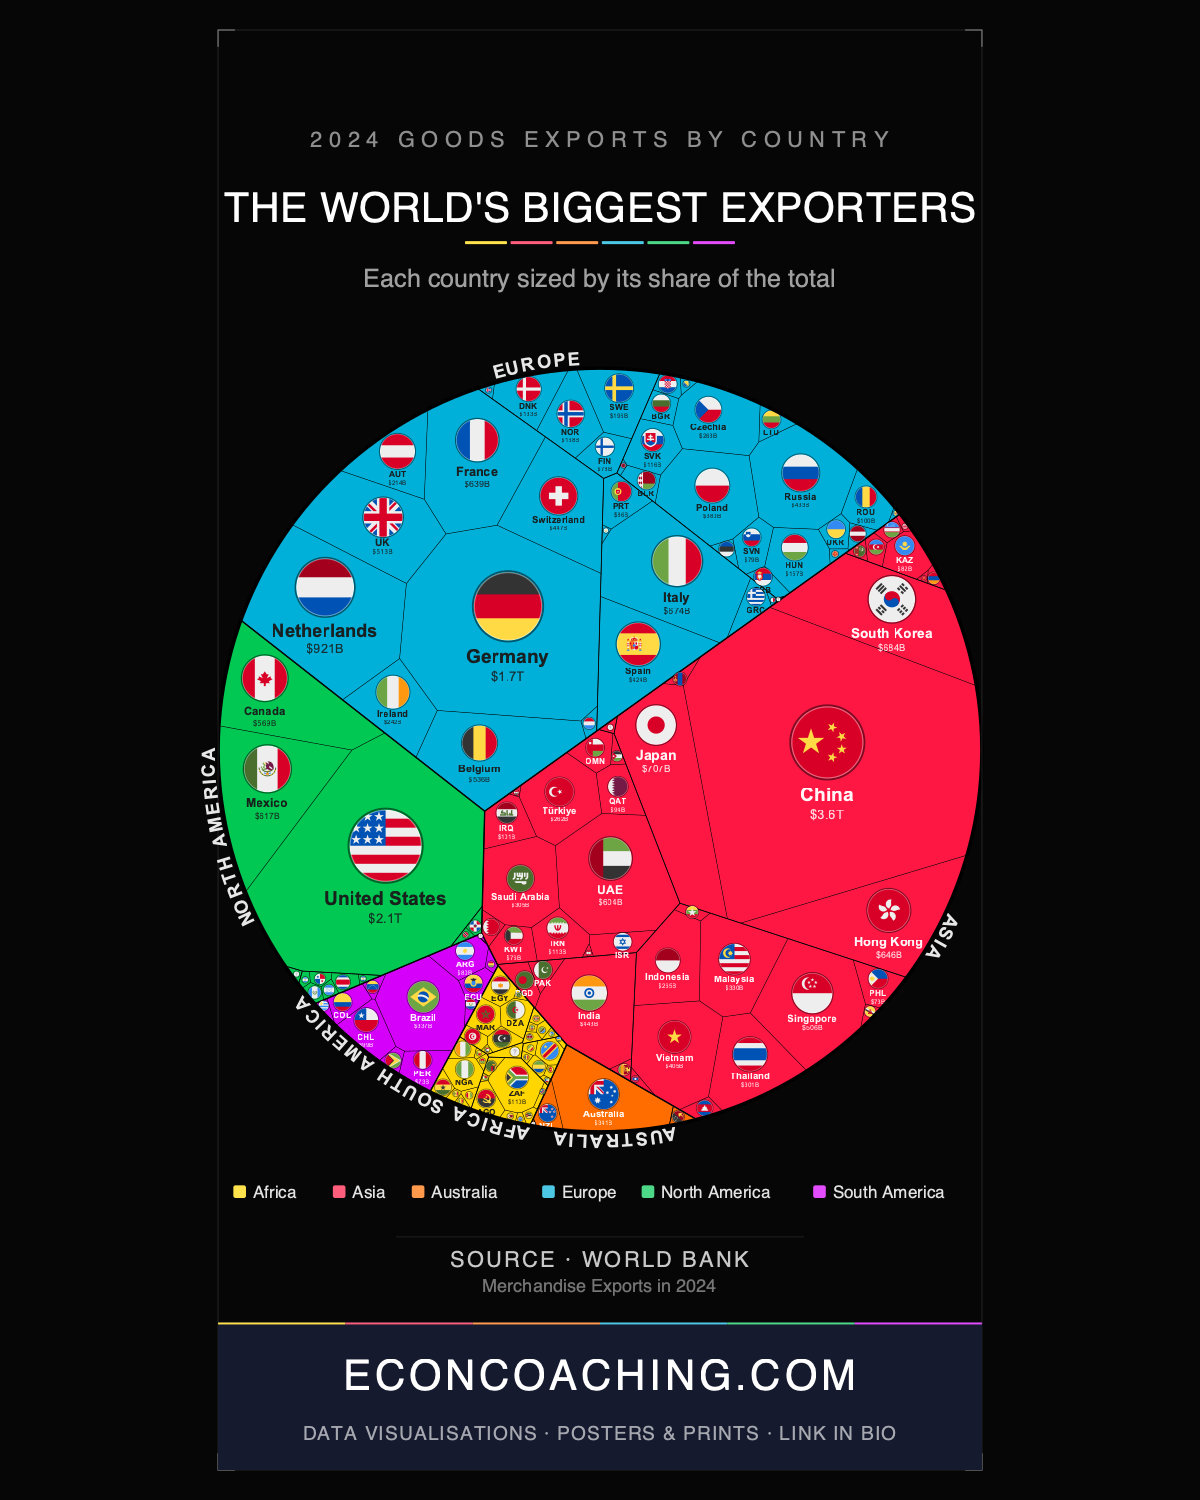
The treemap accompanying this article resizes every country by its merchandise export value, not its land area. China occupies roughly one-seventh of the entire chart. The African continent — 54 countries — appears smaller than the Netherlands, a nation of 18 million people. That visual distortion is not an artifact of bad design. It reflects the actual distribution of $23.97 trillion in global merchandise exports in 2024, and the concentration is more extreme than most readers expect.
China's Export Machine, and What the Headlines Slightly Overstate
China recorded $3.58 trillion in merchandise exports in 2024, nearly 15% of the global total. That figure is 1.74 times larger than the United States ($2.07T) and more than double Germany ($1.68T). China's export share has risen from roughly 4% when it joined the WTO in 2001 to nearly 15% today — one of the fastest sustained expansions of trade share in modern economic history. The most recent composition of that growth reflects a deliberate industrial shift: in 2024, China accounted for 25% of global electric vehicle exports, 48% of lithium-ion battery exports, and 72% of solar module exports, according to data from China's General Administration of Customs.
One qualification applies to the headline number. A significant share of Chinese goods moves through re-export hubs — most visibly Hong Kong, ranked eighth globally at $646 billion, where approximately 99% of merchandise exports are re-exports of goods originating elsewhere, predominantly mainland China. The WTO figures record Hong Kong's re-exports as Hong Kong exports, which means some Chinese manufacturing value is counted twice in global rankings. Even adjusted for this, China's underlying export volume is without historical parallel among individual nation-states.
The Small Countries Running Large Trade Volumes
The Netherlands ranks fourth globally at $921 billion, ahead of Japan ($707B) and South Korea ($684B) despite a population of just 18 million. Rotterdam, Europe's largest port, is the mechanism: the Netherlands has served as Europe's primary trading gateway since its Golden Age in the 17th century, and that geographic and institutional advantage has compounded across centuries. The Dutch statistics agency CBS estimates that nearly half of Dutch export value consists of goods produced abroad and re-exported with minimal domestic processing — meaning the country's genuine value-added contribution to global trade is considerably smaller than $921 billion implies. Even so, the infrastructure, financial, and logistics capacity required to intermediate that volume is itself a form of economic specialisation that smaller economies rarely achieve.
Singapore ($506B, ranked 15th) and Belgium ($536B, ranked 13th) demonstrate the same pattern: small, port-adjacent economies with sophisticated logistics and re-export infrastructure producing headline export figures that far exceed what their domestic manufacturing base alone would generate. For the general reader, the lesson is that export rankings measure trade flows, not necessarily domestic industrial capacity.
How Supply-Chain Rewiring Created New Export Giants
Mexico's rise to tenth globally at $617 billion is a direct consequence of US tariffs on Chinese goods introduced in 2018 and accelerating nearshoring investment by US manufacturers. In 2023, Mexico surpassed China to become the single largest source of US goods imports — ending a decade-long run that began when China overtook Canada in 2014. The United States-Mexico-Canada Agreement (USMCA) reinforced Mexico's structural advantage for companies seeking tariff-free access to the US market while reducing supply-chain exposure to US-China trade tensions.
Vietnam tells a related story. Vietnamese merchandise exports grew from roughly $150 billion a decade ago to $405 billion in 2024 — a near-tripling driven largely by electronics manufacturing, with Samsung and other multinational assemblers relocating significant production capacity out of China. That growth has drawn scrutiny from US trade authorities, who argue that some of the increase reflects Chinese goods being re-routed through Vietnam to avoid tariffs rather than genuine Vietnamese manufacturing value-added. The Peterson Institute for International Economics has examined this pattern in detail. The truth is likely a mixture of both: real capacity has been built in Vietnam, and some degree of tariff arbitrage has occurred simultaneously.
The Extremes of Regional Concentration
Asia as a region generated approximately $10 trillion in merchandise exports in 2024, or 41.7% of the global total — more than Europe (36.9%) and North America (14.0%) combined. South Korea's $684 billion reflects one of the most dramatic export-led development trajectories in modern history, from a war-devastated economy in 1953 to a semiconductor and advanced-manufacturing powerhouse within a single lifetime.
At the other end of the distribution, Africa's 54 countries collectively exported $627 billion in 2024 — 2.6% of the global total and less than the Netherlands alone. South America's entire export base of $739 billion is smaller than Germany's single-country figure of $1.68 trillion. Two structural factors amplify Africa's apparent underperformance: significant informal cross-border trade goes unrecorded, and substantial commodity extraction on African soil is captured under the jurisdiction of foreign companies rather than domestic exporters. The African Continental Free Trade Area (AfCFTA) contributed to a 7.7% rise in intra-African trade in 2024 to approximately $208 billion, but that figure remains a small fraction of the continent's economic potential and an even smaller fraction of global trade flows.
Individual country specialisation creates outliers within these regional averages. Australia ($341B, ranked 22nd) supplies 54.5% of global seaborne iron ore trade; iron ore alone generated approximately $83 billion in 2024, roughly 24% of Australia's total merchandise exports. Brazil ($337B, ranked 23rd) earned nearly half its export revenue — approximately $164 billion — from agriculture, with coffee exports surging 52.6% year-on-year in 2024.
What the 2025 Tariff Round Will Likely Change
The 2024 data captures a specific inflection point: China posting record export values despite sustained Western decoupling pressure, Mexico cementing a structural shift in US import sourcing, and Vietnam completing a decade of supply-chain-driven expansion. The new round of US tariffs announced in 2025 is already generating further rerouting of trade flows. Whether Vietnam retains its growth trajectory, whether Mexico absorbs additional manufacturing investment, and whether China's green technology exports continue to expand against rising trade barriers in Europe and North America are the variables most likely to redraw the rankings between now and 2030. The global export map is being restructured faster than at any point since China's WTO accession in 2001.
For more data-driven analysis of global economics and the trends reshaping world trade, visit econcoaching.com.
Take this one home
Get this visualisation as a download, wallpaper, or printed poster.
← Back to all visualisations & articles
Follow Everything Econ: YouTube · TikTok · X · Instagram · Facebook