
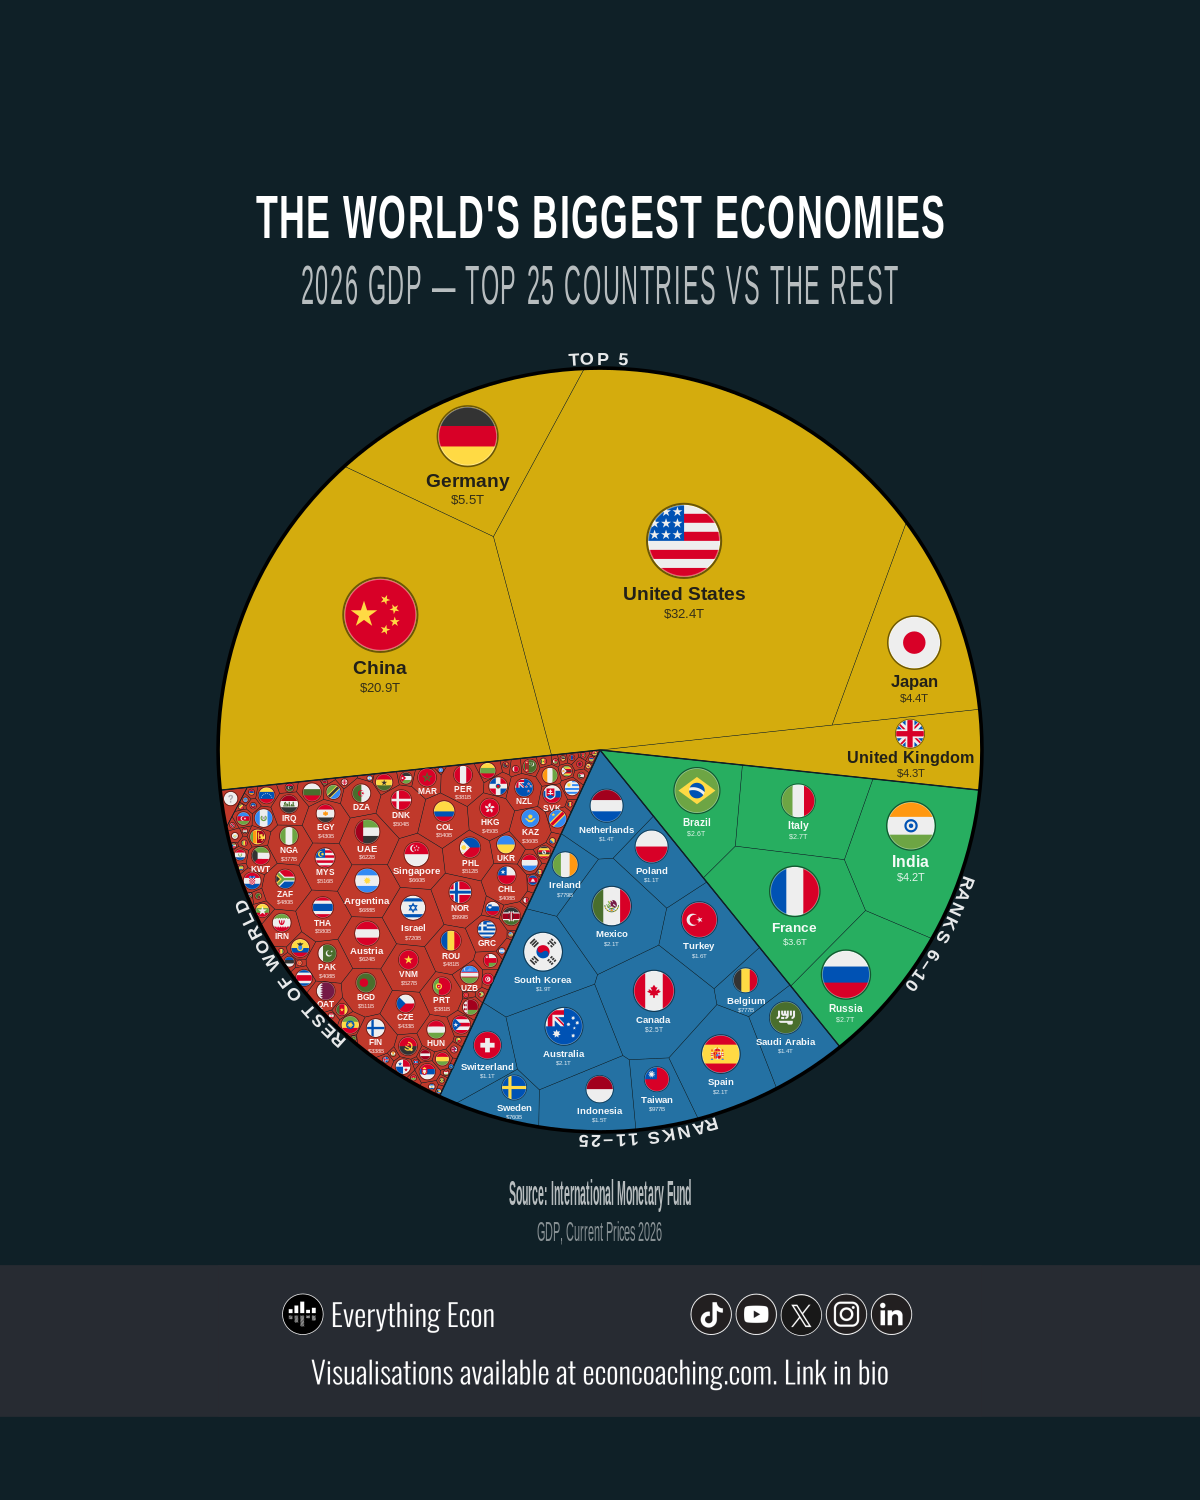
The treemap accompanying this article makes the same point a political map cannot: just five countries — the United States, China, Germany, Japan, and the United Kingdom — occupy more than half the entire visual field. That is not a design choice. Cell area is proportional to GDP, and those five economies collectively account for 53% of the $126 trillion world economy in 2026. The remaining 188 countries share the other 47%.
How Five Countries Came to Own Half the World Economy
The US leads with $32.4 trillion, representing 26% of global output on its own. China follows at $20.9 trillion, or 16.52%. Germany, Japan, and the United Kingdom each sit between $4.3 trillion and $5.5 trillion — substantial economies, but so far behind the top two that the real story of the chart is the gap between first and second, and between second and third. Germany at $5.5 trillion is less than a third of China’s total.
The US-China gap of approximately $11.5 trillion in nominal terms can mislead, however. On a purchasing-power-parity basis, which adjusts for differences in domestic price levels, China overtook the United States in 2014 and has held the top position since. The nominal gap reflects partly the yuan’s depreciation against the dollar, not exclusively a difference in real productive capacity. In 1980, the US economy was roughly 15 times larger than China’s in nominal terms — $2.86 trillion against $190 billion. The convergence to a 1.55× gap by the early 2020s represents the most significant economic shift of the post-war era. That gap has partially widened again since then, driven more by currency movements than by any reversal in China’s underlying growth trajectory.
India’s Position and What the Rankings Actually Measure
India ranks sixth in the 2026 chart at $4.15 trillion — behind Japan at $4.4 trillion and the UK at $4.3 trillion — but this ranking contains a specific distortion. The Indian rupee depreciated approximately 11% against the US dollar in 2026, reducing India’s nominal dollar-denominated GDP without any corresponding fall in real output. In PPP terms, India is already the world’s third-largest economy, ahead of both Germany and Japan. In nominal terms, the IMF projects India will overtake Japan to become the third-largest economy by 2027, with real GDP growth running at 6.48% in 2026 — the fastest rate among major economies.
The broader lesson here applies across the chart: nominal GDP rankings are exchange-rate rankings as much as output rankings. Japan’s position at fourth illustrates this from the opposite direction. Japan ranked second globally in GDP per capita in 2000, behind only Luxembourg. By 2026, despite retaining the fourth-largest total GDP, it ranks approximately 39th in per-capita terms — a decline driven by structural stagnation and persistent yen weakness rather than any collapse in Japan’s physical productive base. A large total GDP does not describe how wealthy a country’s population is.
The Anglosphere’s Concentration and Africa’s Absence
The five major Anglophone economies — the United States, United Kingdom, Canada, Australia, and New Zealand — collectively account for approximately 31% of global GDP, or roughly $39 trillion. Australia at $2.1 trillion ranks twelfth globally and is projected to overtake South Korea at $1.9 trillion in 2026 nominal rankings, a reminder that the top 20 shifts more frequently than it appears. Germany itself overtook Japan in 2023 to claim third place, the first time Japan had fallen below third since the 1960s.
Against this concentration of output among a small number of wealthy states, Africa’s aggregate GDP in 2026 stands at approximately $3.32 trillion — less than Germany alone, and below 3% of the $126 trillion global total. Africa holds roughly 18% of the world’s population. Nigeria, despite sitting outside the top 25 by total output, is projected to contribute 1.5% of total global real GDP growth in 2026, ranking sixth globally by growth contribution ahead of Germany, Brazil, and Indonesia. Growth contribution and current size are different measures, and on growth contribution, parts of Africa are already globally significant. The African Continental Free Trade Area (AfCFTA) is the institutional mechanism most likely to shift that balance over the medium term, though implementation remains uneven.
Outliers That the Treemap Cannot Show
Guyana does not appear in the top 25 by total GDP and occupies a cell too small to label in the treemap, but its growth rate since 2022 is the most extreme in the world — averaging approximately 47% per year in real terms following offshore oil discoveries in the Stabroek Block. For a country of fewer than one million people, the scale of output expansion is arithmetically extraordinary. The World Bank and IMF both flag it as the fastest-growing economy globally by a wide margin.
The caution is equally extreme. GDP growth concentrated in a single offshore commodity sector, operated largely by international firms, creates acute risks of the resource curse: revenues that flow to government and foreign shareholders without building the domestic skills, institutions, or economic diversification needed for long-run prosperity. Guyana’s growth rate headline and its development challenge exist simultaneously.
Ireland sits at the other end of the per-capita spectrum — ranked approximately second globally in GDP per capita in 2026, up from fourteenth in 2000, driven by the concentration of US technology, pharmaceutical, and financial firms booking profits through Dublin. Its total GDP is modest relative to the top-25 list, which is precisely why per-capita figures tell a structurally different story than aggregate rankings.
The $126 Trillion Threshold and What Comes Next
The IMF’s April 2026 World Economic Outlook records the first year in which global nominal GDP has crossed $125 trillion. The world economy was approximately $66 trillion in 2012, meaning the nominal total has nearly doubled in 14 years — though a portion of that reflects dollar depreciation and global inflation rather than real output gains. Within that doubling, the distribution has become marginally less concentrated at the very top as India, Indonesia, and parts of sub-Saharan Africa have grown faster than the established large economies. The structural question for the next decade is whether that redistribution accelerates — driven by India’s demographic expansion, Africa’s growth contribution, and continued yuan internationalisation — or whether the 53% club retains its grip on the global output map.
For more data-driven analysis of the global economy, visit econcoaching.com.
Take this one home
Get this visualisation as a download, wallpaper, or printed poster.
← Back to all visualisations & articles
Follow Everything Econ: YouTube · TikTok · X · Instagram · Facebook