
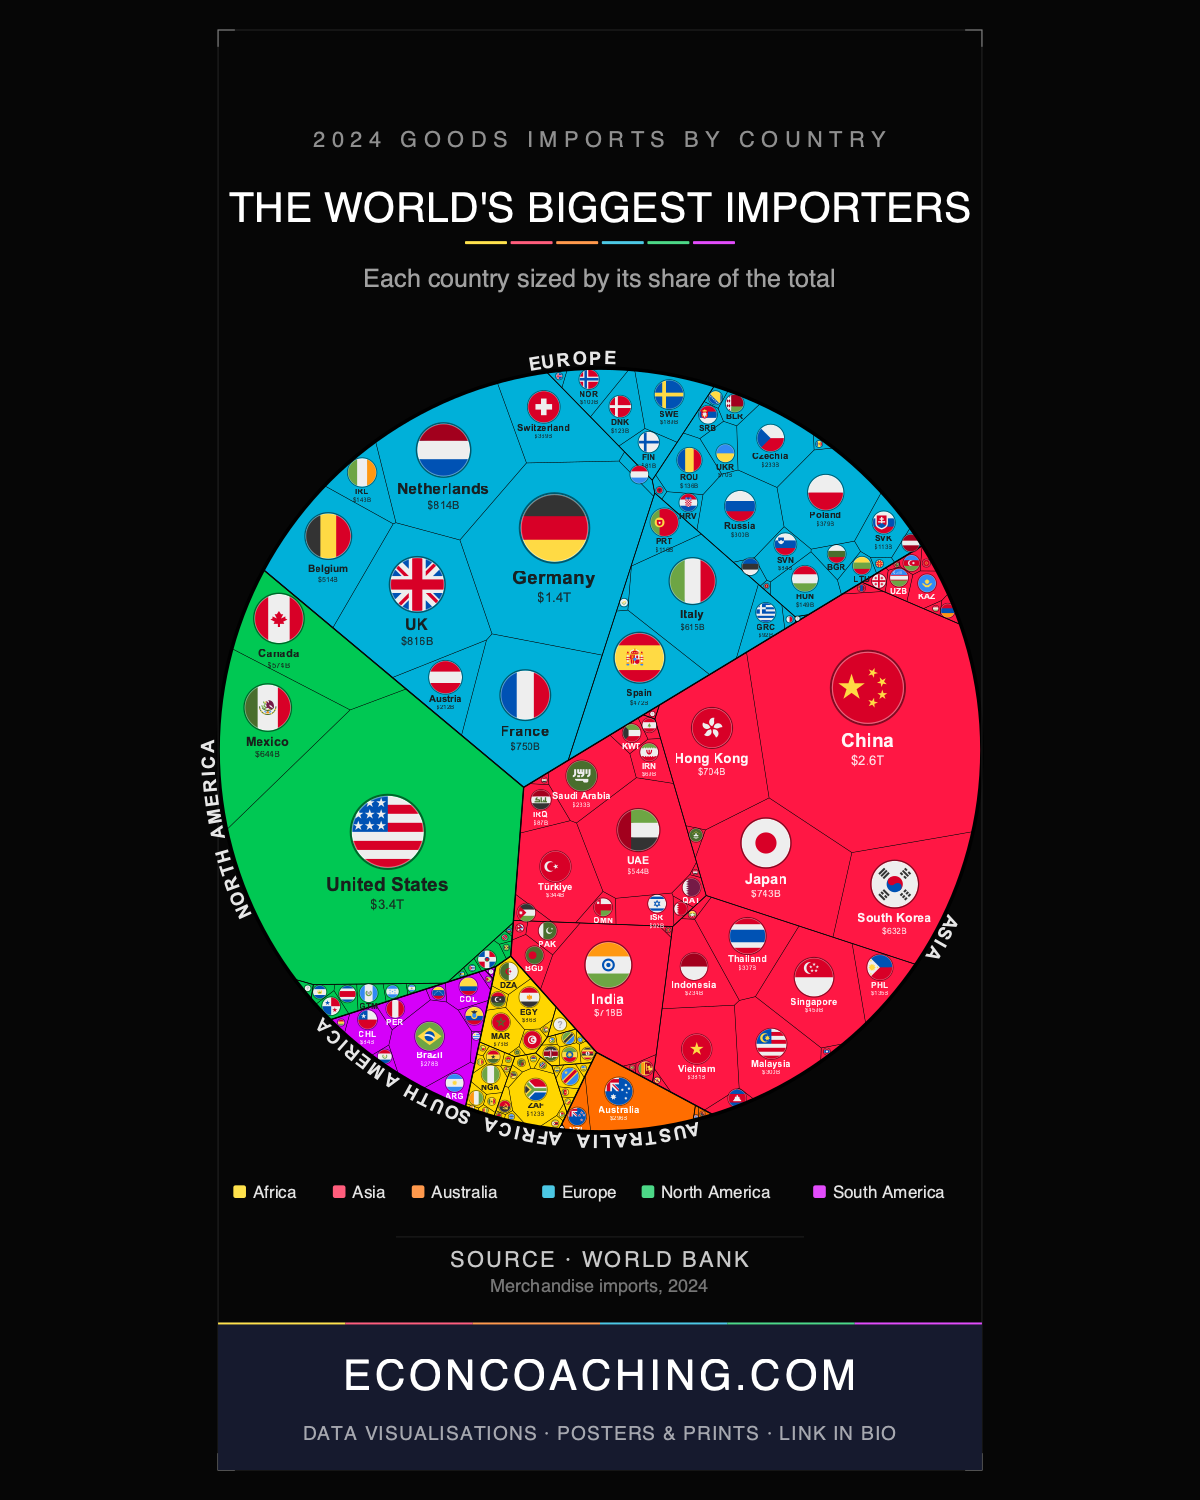
The treemap accompanying this article resizes every country by what it actually buys from the world — and the distortion is immediate. The United States occupies nearly 14% of the entire chart. That single visual fact — one country absorbing $3.36 trillion of the world's $24.36 trillion in merchandise imports — is the starting point for understanding why 2024's trade rankings look so different from those of even five years ago.
The US Stands Alone, but Its Supplier Map Has Been Redrawn
At $3.36 trillion, no other country comes close to the USA's concentration of import demand. What has changed dramatically is where those imports originate. In 2023, Mexico overtook China as America's top goods supplier for the first time in over two decades — the previous time Mexico held that position was 2002, before China's WTO accession remade global manufacturing. By 2024, US imports from Mexico reached approximately $506 billion against $439 billion from China. China's share of US imports had peaked at 21.6% in 2017–18 and had fallen to 13.4% by 2024, a direct consequence of the tariff escalation that began under the Trump administration's first term.
Mexico's rise is real, but it requires qualification. The Federal Reserve Bank of New York has documented a pattern where Chinese manufacturers route goods through Mexican facilities to circumvent US tariffs, meaning a portion of what registers as Mexican imports embeds significant Chinese value-added. The USMCA framework encourages genuine nearshoring, and there is substantial evidence of authentic supply-chain relocation, but the headline figure overstates the degree to which Mexican domestic manufacturing has displaced Chinese production.
Vietnam and Poland Signal Where Supply Chains Are Landing
Vietnam posted the strongest import growth of any top-20 importer in 2024 — a 17% year-on-year surge to $380 billion, ranking it 18th globally. That figure is almost entirely structural: roughly 93% of Vietnam's imports are classified as production materials, meaning the country functions as a final assembly hub absorbing components for re-export rather than as a consumer market. Its transformation from an agricultural economy to a top-20 importer is among the fastest trade ascents in modern history — merchandise imports grew from under $100 billion in 2012 to $380 billion in 2024, a roughly fourfold increase driven by FDI from Samsung, Intel, and other electronics manufacturers explicitly diversifying away from China.
Poland at $379 billion (rank #19) reflects a parallel dynamic in Europe. It is now the largest merchandise importer in Central and Eastern Europe, having surpassed Russia ($300 billion, rank #24) — a reversal shaped by post-2022 sanctions on Moscow and by Poland's deep integration into EU manufacturing supply chains. These two countries, Vietnam and Poland, are not adjacent in geography or political economy, but they appear at similar positions on the treemap for the same underlying reason: both are beneficiaries of the global "China+1" rewiring that tariffs and geopolitical risk have accelerated.
The Entrepôt Illusion: Netherlands, Hong Kong, and What Rankings Actually Measure
The Netherlands ($814 billion, rank #5) and the United Kingdom ($816 billion, rank #4) are separated by just $1.9 billion — yet the Netherlands has roughly one-quarter of the UK's population, around 18 million versus 68 million. Hong Kong, a single city of 7.5 million people, imports $704 billion in merchandise (rank #9), more than all of South America's $636 billion combined. These figures require a structural footnote: the OECD's Balanced International Merchandise Trade Dataset adjusts for the distortion created by entrepôt hubs, where a large share of recorded imports are goods in transit destined for re-export. Roughly 90% of Hong Kong's total exports are re-exports, and the Netherlands functions as Europe's dominant logistics gateway, with Rotterdam processing a substantial share of the continent's containerised trade before goods move inland. Raw import rankings overstate the domestic demand of these economies; they are measuring logistics infrastructure as much as consumption.
Europe's Import Contraction and the Chip Surge
Europe is the only major region that recorded negative import volume growth in 2024, with merchandise import volumes falling approximately 3.3% in the first three quarters year-on-year. Germany, France, and Italy all registered declines as a prolonged manufacturing downturn suppressed industrial demand. China's import growth was also subdued — sluggish domestic consumption and falling commodity prices kept value growth moderate even as volumes held up, a deflationary dynamic rather than a demand collapse. By contrast, G20 merchandise import volumes fell 0.2% in aggregate, while services trade grew 7.4%, suggesting that global consumption is shifting structurally toward intangibles that merchandise rankings cannot capture.
Against that backdrop, the product-level data is striking. Computer parts and accessories were the fastest-growing import category globally in 2024, up 43.9% year-on-year, followed by computers and optical readers at 29.8% and integrated circuits at 11.1%. Coal imports fell 18.9% and petroleum gases dropped 14.1%. The electronics surge maps directly onto the AI infrastructure buildout — data centres require chips, and chips require the kind of precision components that Vietnam, Taiwan, and South Korea are increasingly positioned to supply.
Africa's 3% and the AfCFTA Trajectory
All 54 African nations together account for 3.0% of world merchandise imports — $727 billion, less than Germany alone. South Africa leads the continent at $123 billion (rank #36) and Egypt follows at $86 billion (rank #44). Africa holds approximately 17% of the world's population but has maintained a persistent 3% share of global imports for decades, a structural gap reflecting underdeveloped manufacturing capacity, infrastructure deficits, and historically fragmented intra-continental trade. Intra-African trade reached $208 billion in 2024, up 7.7%, driven by the progressive rollout of the African Continental Free Trade Area (AfCFTA), which has been reducing intra-African tariffs since 2021. Africa's merchandise trade deficit narrowed to $37 billion in 2024 from $80 billion in 2023, a meaningful shift. Whether AfCFTA can move Africa's global import share materially over the next decade depends on infrastructure investment, customs harmonisation, and private sector depth — all of which remain constrained relative to the ambition of the agreement.
The April 2025 wave of US tariffs is already feeding into 2025 import flows, with early data suggesting further acceleration in Vietnam and Mexico and continued compression in Chinese export volumes to the United States. The 2024 rankings are a snapshot of a system mid-transition, not an equilibrium.
For more data-driven analysis of global economics and the trends reshaping the world economy, visit econcoaching.com.
Take this one home
Get this visualisation as a download, wallpaper, or printed poster.
← Back to all visualisations & articles
Follow Everything Econ: YouTube · TikTok · X · Instagram · Facebook