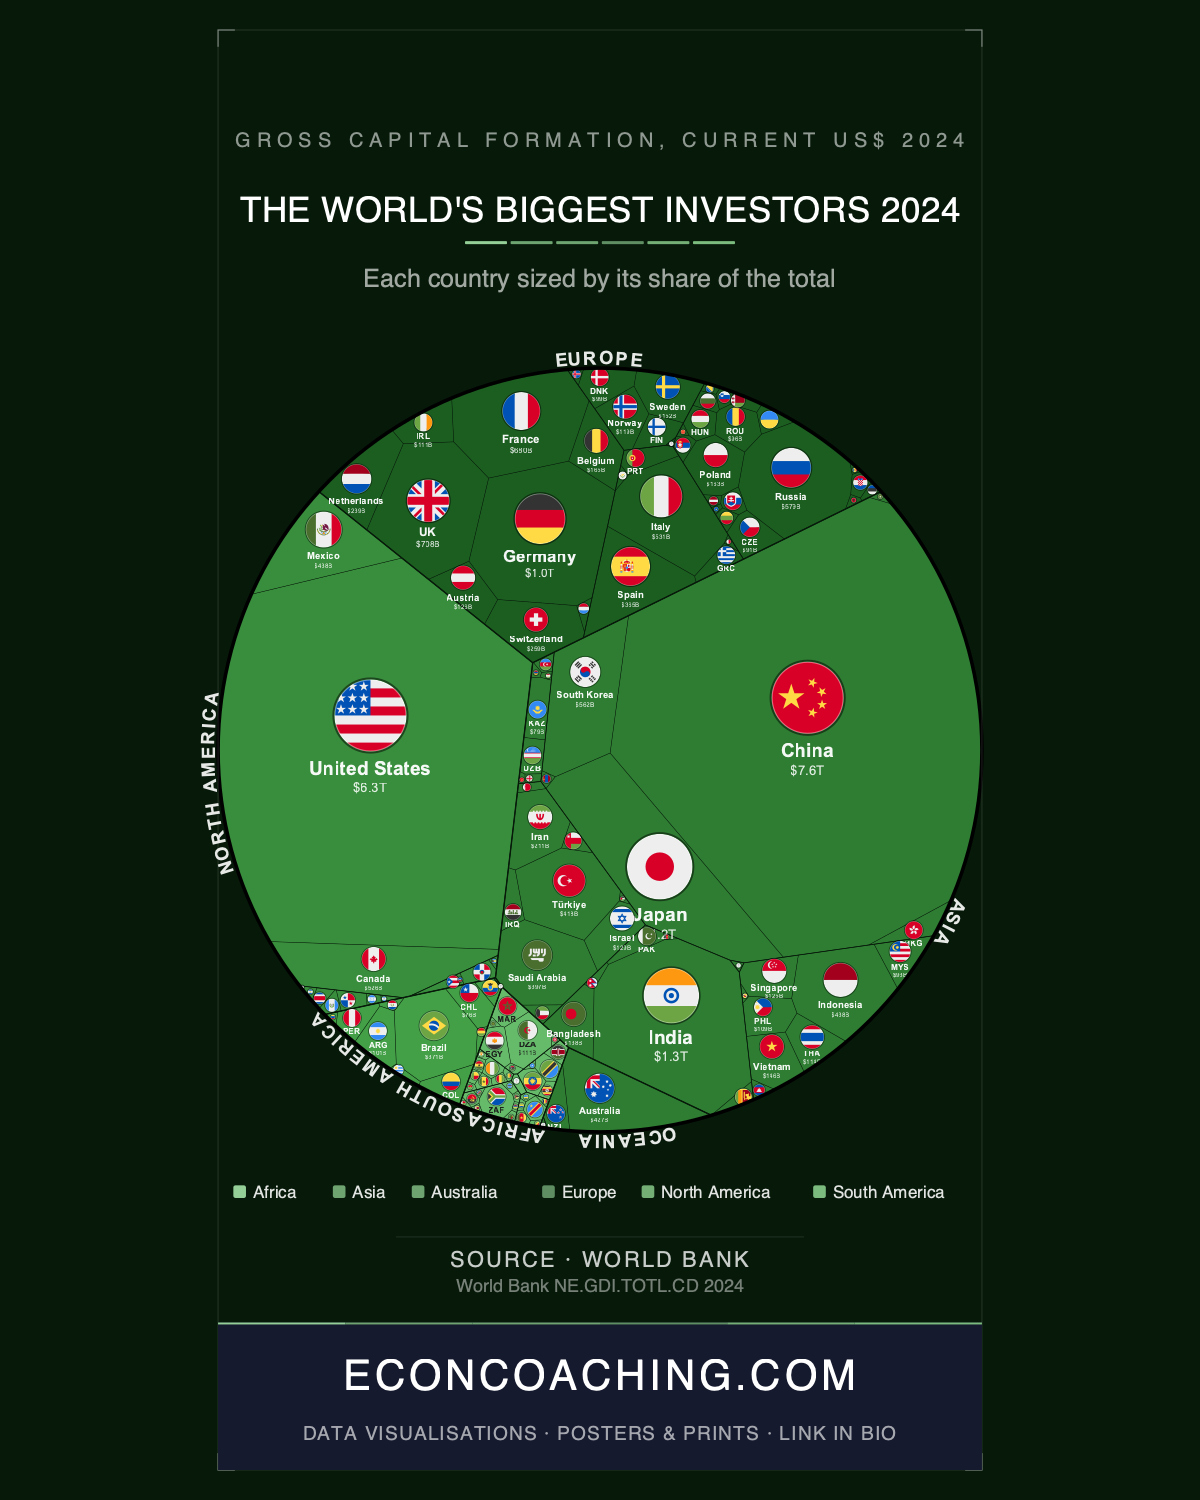
In the treemap accompanying this article, India's rectangle is larger than Germany's, the United Kingdom's, and France's individually, even though India's economy remains smaller than Germany's on standard GDP measures. India recorded $1.37 trillion in gross fixed capital formation (GFCF) in 2025, 9.65% of the global total of roughly $14.18 trillion across 121 countries, ahead of Germany's $1.11 trillion, the UK's $788 billion, and France's $739 billion. A country still classified as developing now channels more capital into fixed investment than any single Western European economy, including the continent's industrial anchor.
India's Ascent to the Top of the Global Investment Table
India's $1.37 trillion places it first in the IMF and World Bank's 2025 GFCF estimates, ahead of Germany, the UK, France, and every other country in the 121-nation dataset. As recently as 2009, India ranked 11th globally by GDP; by the end of 2025 it had climbed to 4th, and its GFCF ranking mirrors that broader climb up the global economic table. The composition of the investment is shifting too. GFCF grew 9.4% in the fourth quarter of fiscal year 2024-25, its strongest quarterly reading in over a year, with early signs that private sector capital expenditure is finally joining a boom that had until recently been driven mostly by government spending.
Scale Versus Ratio: What India's 29.6% GDP Share Reveals
India's rank at the top of the global GFCF table is a function of the size of its economy as much as the intensity of its investment. Gross fixed capital formation stood at around 29.6% of GDP in 2024, only modestly above what is typical worldwide. That distinction matters: India's global rank reflects economic mass and a fast-growing base, not an investment ratio that stands out among its peers. The productivity of that capital, measured against Germany, France, or Australia, still lags those developed economies even as the absolute total leads the world.
Germany's Paradox: Second Place, Fifth Consecutive Decline
Germany's $1.11 trillion keeps it in second place globally, yet the headline figure obscures a country in its longest period of economic stagnation in seven decades. Overall GFCF fell 0.5% in 2025, the fifth consecutive annual decline in construction investment. Business investment in machinery and equipment fell to a 15-year low in early 2025, according to Destatis, as German firms absorbed US tariffs, competition from Chinese manufacturers, and high energy costs at the same time. Germany's FDI stock lost 1.2% of its value between 2020 and 2024, a pattern more commonly associated with unstable developing economies than with the world's third-largest exporter. In March 2025 the government loosened the constitutional debt brake, a first structural policy response under Chancellor Friedrich Merz aimed at reversing the construction and investment slide.
Europe's Regional Dominance and the Conduit Flow Distortion
Europe as a region still accounts for 47.1% of global GFCF in 2025, more than Asia's 32.6% and North America's 7.5% combined, driven largely by the continent's four biggest investors: Germany, the UK, France, and Switzerland. That regional dominance sits alongside a fragile picture in global capital flows more broadly. UNCTAD's Global Investment Trends Monitor No. 50 and the World Investment Report 2025 found that global FDI rose 14% in 2025 to $1.6 trillion, but once flows through financial conduits such as the Netherlands, Belgium, and Luxembourg are stripped out, the real underlying increase was only about 5%. UNCTAD Secretary-General Rebeca Grynspan has pointed to that fragility beneath the headline growth: SDG-related investment projects fell a further 10%, project finance declined for a fourth consecutive year, and early 2025 data showed record-low deal and project activity. Europe's 47.1% share is real in the data, but a meaningful portion of it is routed through financial centres rather than representing brick-and-mortar productive investment on the ground.
Middle Powers and the New Investment Frontier
Outside the top two, the 2025 rankings show a wider reshuffling. Türkiye ranks 9th globally with $506 billion, 30.6% of its GDP, a striking figure given years of high inflation and currency volatility, and it surpasses Indonesia's $443 billion in 10th place. Algeria ranks 28th globally with $130 billion, the largest GFCF total in Africa, and was rated the second most attractive investment destination on the continent in 2025 despite inward FDI averaging just 0.4% of GDP over the prior five years, a turnaround traceable to its 2020 repeal of a 49/51 foreign ownership rule that had restricted investors for over a decade. Australia sits 11th globally with $440 billion, the only Oceania nation to appear in the global top 20, an outsized position for a country of roughly 27 million people. Brazil leads South America with $389 billion, 2.75% of the global total, more than triple Argentina's $110 billion in second place on the continent. Layered on top of these national totals is a structural shift in what capital is being built: data centres alone accounted for more than a fifth of all global greenfield project values in 2025, with announced investment exceeding $270 billion on the back of AI infrastructure demand, while investment in critical minerals collapsed to 63% below 2024 levels.
What the Rankings Point Toward
The 2025 data describes two economies moving in opposite directions at the top of the table: India scaling its investment base alongside its climb up the global GDP rankings, Germany defending a large absolute total while its underlying construction and machinery investment keeps contracting. Whether India can convert its lead in capital formation into the per-capita productivity gains that still separate it from Germany, France, or Australia, and whether Germany's debt brake reform arrests five years of declining construction investment, will shape how this table looks by the end of the decade.
For more data-driven analysis of global economics and the trends reshaping the world economy, visit econcoaching.com.
Take this one home
Get this visualisation as a download, wallpaper, or printed poster.
← Back to all visualisations & articles
Follow Everything Econ: YouTube · TikTok · X · Instagram · Facebook