
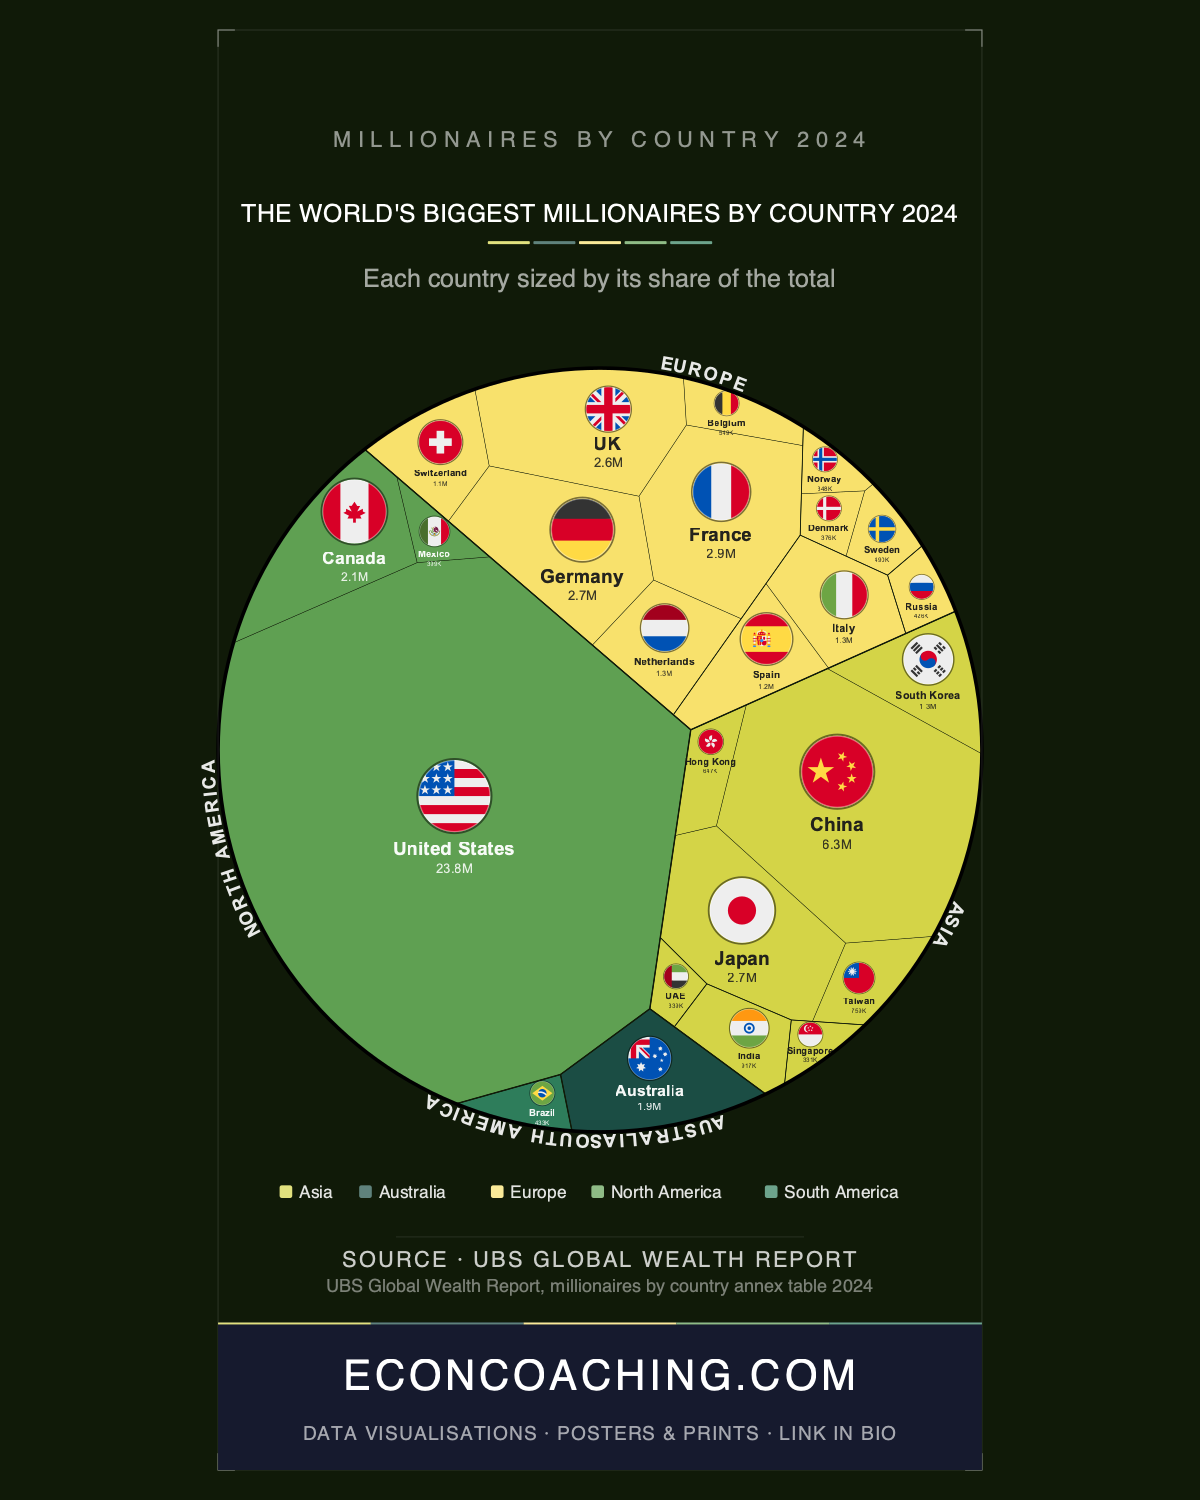
The United States holds 41.56% of the world's tracked millionaires, a single country outweighing Europe's 26.7% share and Asia's 23.3% share combined. The treemap accompanying this article sizes each country by its millionaire count rather than its landmass, and the American rectangle swallows nearly half the frame. That distortion, more than any single ranking, is the story the UBS Global Wealth Report 2025 and Capgemini World Wealth Report 2025 tell about global wealth in 2024.
The United States Sets a Scale Nothing Else Matches
23,831,000 Americans qualify as millionaires, a total that on its own outranks the next 24 countries in the top 25 combined. North America holds 45.9% of the world's millionaires; South America holds 0.8%, a roughly 57:1 gap between two continents that each contain a G20 economy. Brazil supplies every one of South America's entries in the ranking, with 433,000 millionaires, 0.76% of the global total, despite ranking as the world's ninth-largest economy by GDP. The concentration in North America is not a function of population size relative to South America's; it reflects where financial and real-estate wealth has actually accumulated.
France's Bronze Medal Is a Property Story, Not a GDP Story
France ranks third globally with 2,897,000 millionaires, ahead of Japan (2,732,000, rank four) and Germany (2,675,000, rank five), even though both Japan and Germany have larger economies than France. France's count of "everyday millionaires" has quadrupled since 2000, and the growth is attributed largely to rising real estate valuations rather than expanding productive wealth. That distinction matters for reading the whole ranking: UBS counts net worth, which includes the value of a primary residence, so a housing boom in France's residential market shows up in this dataset the same way a stock portfolio does.
China's Millionaire Count Grows, but Its Wealth Machine Is Slowing
China holds the number two spot with 6,327,000 millionaires, yet its HNWI population fell 1% in 2024, a rare contraction tied to property and equity market weakness. The shift shows up elsewhere too: the United States overtook China in billionaire count for roughly the first time in a decade, with 870 US billionaires against 823 in China. India offers the opposite trajectory. Its HNWI population grew 5.6% in 2024, outpacing China, and its collective HNWI wealth rose 8.8% year-on-year to $1.5 trillion, even though India ranks only 14th in absolute millionaire count. India's 917,000 millionaires are spread across roughly 1.4 billion people, close to one millionaire per 1,500 residents, a per-capita reality the raw ranking hides entirely.
Small Populations, Concentrated Wealth
Switzerland ranks 13th in absolute terms with 1,119,000 millionaires, but it leads the world on a per-capita basis at roughly 145 millionaires per 1,000 adults, close to one in seven adults. Australia, with 1.9 million millionaires, has a rate exceeded globally only by Luxembourg and Switzerland, and matched by Hong Kong, putting roughly one in ten Australians in millionaire territory. Singapore ranks 25th in absolute count with 331,000 millionaires, roughly one in twenty residents, and its millionaire population has grown 62% over the past decade, far outpacing the 3 to 4% growth recorded in Tokyo and Hong Kong over the same period. Australia's and Switzerland's high per-capita ranks, like France's, owe a good deal to housing price growth rather than financial asset accumulation, a pattern that recurs across the wealthiest small economies in this dataset.
Europe Stalls While Africa Barely Registers
Europe's HNWI population declined 2.1% in 2024, driven mainly by stagnation in Germany and the UK. The UK and the Netherlands are among the only countries projected to hold fewer millionaires in 2028 than in 2024, with the UK expected to lose around 81,500. Africa's entire tracked millionaire population is approximately 135,200, according to the Henley & Partners Africa Wealth Report 2024, fewer than Singapore's 331,000 despite Singapore's population of just 6 million against Africa's 1.4 billion. New World Wealth analyst Andrew Amoils has tied part of that gap to capital flight: Africa has lost roughly 18,700 HNWIs to outward migration over the past decade, a period in which South Africa's rand fell 43% against the US dollar, eroding dollar-denominated wealth even where local gains occurred. Africa's millionaire population is still projected to rise 65% over the next decade, the fastest projected growth rate in this dataset alongside Taiwan's, which is expected to grow 47% between 2023 and 2028 on the strength of its semiconductor industry.
What the Next Decade Might Redraw
The number of millionaires across the countries UBS has tracked since 2000 has grown from approximately 14.7 million to 57.3 million in 2024, nearly a fourfold increase in 24 years. The debate that Thomas Piketty and organisations like Oxfam have raised for years, over how concentrated that growth has become, is visible directly in this year's regional splits: America gaining, Europe stalling, China's HNWI count contracting for the first time in years, and Africa still absent from the top ranks despite the fastest projected growth on the list. If Taiwan's and Africa's projected growth rates hold through 2028, and if India's wealth expansion continues to outpace China's, the shape of this treemap in five years may look noticeably different from the one published in the UBS and Capgemini reports this year.
For more data-driven analysis of global economics and the trends reshaping the world economy, visit econcoaching.com.
Take this one home
Get this visualisation as a download, wallpaper, or printed poster.
← Back to all visualisations & articles
Follow Everything Econ: YouTube · TikTok · X · Instagram · Facebook