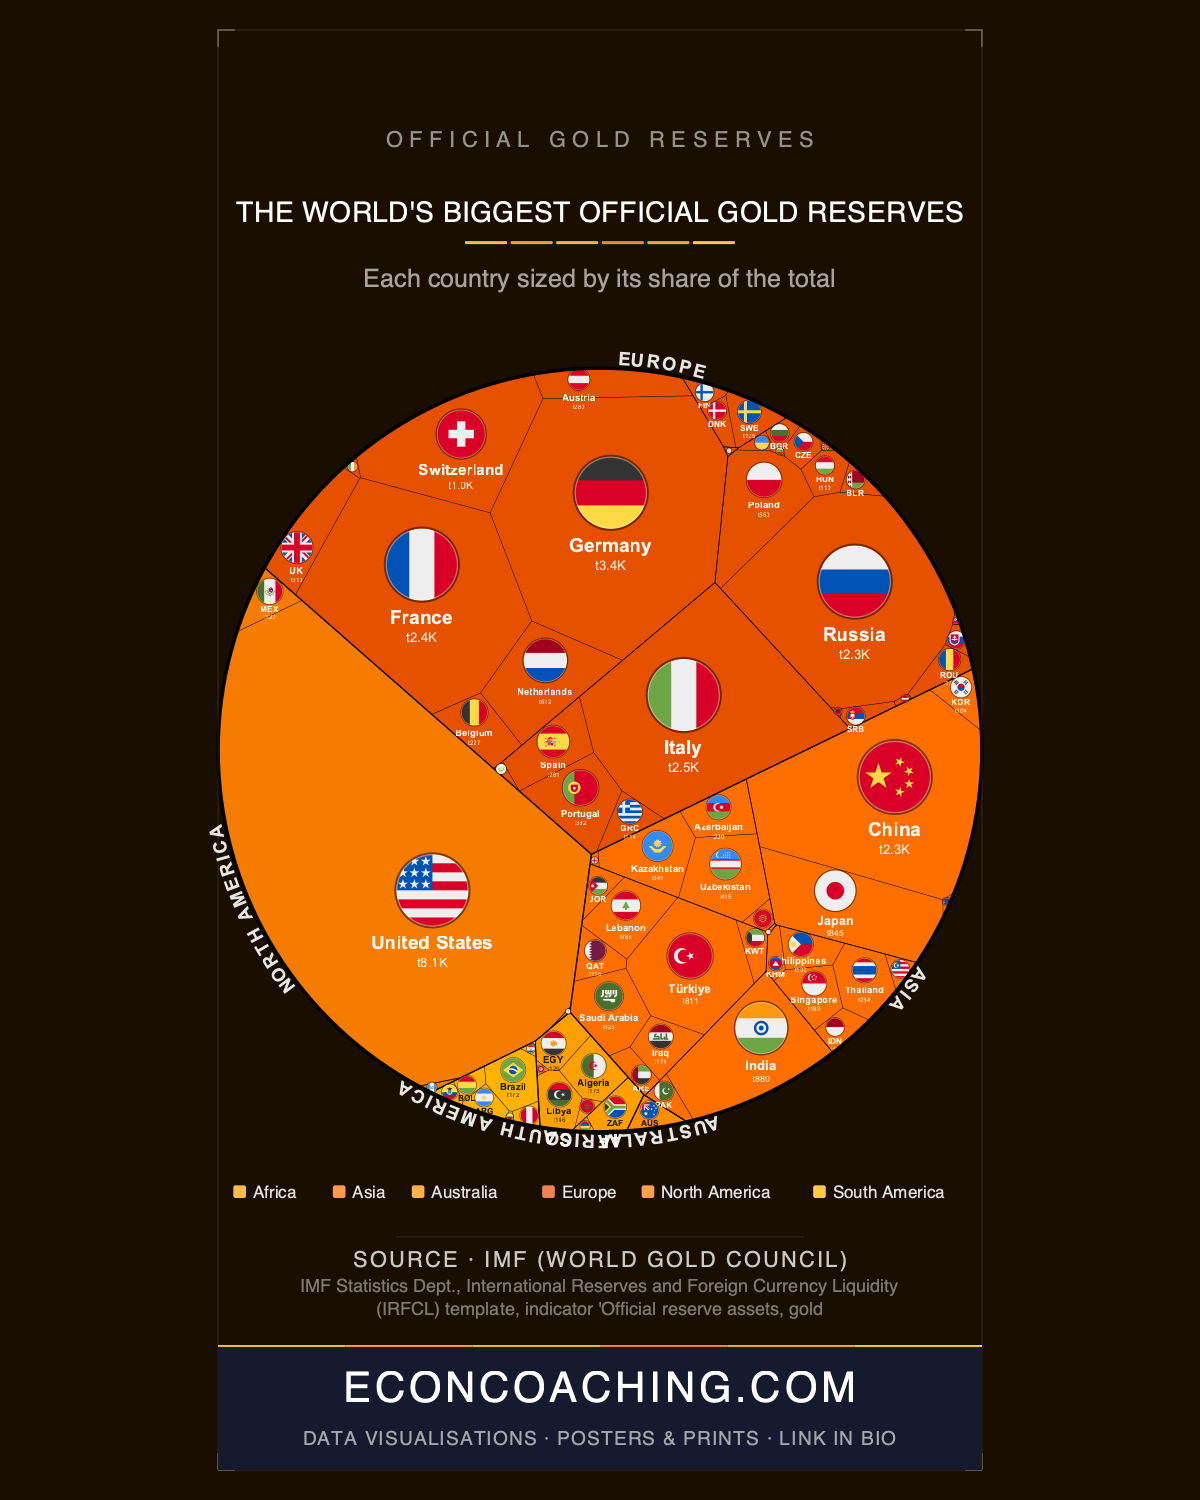
The United States holds 8,134 tonnes of gold — nearly as much as Germany, Italy, and France combined — yet has neither bought nor sold a significant quantity in over 40 years. That frozen dominance, made immediately visible in the treemap accompanying this article where cell area is proportional to reserve volume, sits alongside one of the strangest accounting facts in modern finance: those same reserves are still officially valued at $42.22 per ounce, a price set in 1973 as a Bretton Woods legacy. At 2025 market prices above $4,000 per ounce, the US gold stock is worth over $600 billion — the books say approximately $11 billion. The world's largest official gold reserve is simultaneously the most static and the most mispriced asset on any sovereign balance sheet.
A Legacy of Bretton Woods, Not Active Strategy
The US reached its peak gold holding of approximately 19,757 tonnes in the early 1940s, accumulated through the Bretton Woods architecture that required member nations to hold gold and peg their currencies to a dollar convertible at $35 per ounce. The Nixon Shock of 1971 ended convertibility, the system collapsed, and the US stopped accumulating. What remained — 8,134 tonnes — has barely moved since. Germany (3,350t), Italy (2,452t), and France (2,437t) tell the same structural story: large reserves built under a system that no longer exists, held by governments that have made no sustained effort to add to them. Italy and France in particular hold enormous quantities despite decades of growing public debt, raising a legitimate question about whether their gold functions as genuine monetary policy reserve or simply as an inert balance sheet entry from another era. Fort Knox compounds the credibility question: the last full independent audit of the United States Bullion Depository was conducted in the 1950s, and while congressional visits in 1974 and 2017 confirmed gold was present, no complete weighing and assay of all bars has been conducted — a gap that has re-entered public debate as the Trump administration has floated the idea of a new audit.
The Buyers Reshaping the Rankings
Against that static Western backdrop, the active accumulation programs of the past decade represent a structural reorientation. According to World Gold Council and IMF International Financial Statistics data, central banks purchased 1,237 tonnes of gold in 2025 — the third consecutive year above 1,000 tonnes, roughly twice the decade-long average annual purchase rate. The single most dramatic national example is Poland. The Narodowy Bank Polski, under Governor Adam Glapinski, went from 103 tonnes in 2018 to over 550 tonnes by 2025 — a more than fivefold increase in under seven years, explicitly linked to Poland's proximity to the Russia-Ukraine war. Poland's 550 tonnes now exceed the European Central Bank's 506 tonnes, meaning a single EU member state holds more gold than the institution that manages the euro. Russia and China each more than quintupled their reserves since 2000, with Russia growing from roughly 12.36 million to 75 million troy ounces and China from 12.70 million to approximately 73.29 million. China's official figure of 2,306 tonnes, however, is widely regarded as an undercount: the People's Bank of China stopped publicly reporting purchases in May 2024, and institutional analysts estimating from Shanghai Gold Exchange throughput and domestic mine output of approximately 380 tonnes per year — the world's largest — place actual Chinese holdings closer to 4,000–5,000 tonnes.
The 2022 Turning Point
The proximate catalyst for accelerating emerging market purchases is identifiable and specific. When the US and EU froze approximately $300 billion in Russian foreign exchange reserves following the Ukraine invasion in 2022, it demonstrated that dollar-denominated reserve assets held in Western financial infrastructure could be immobilised by political decision. Gold held domestically cannot be sanctioned, seized, or frozen by a foreign government. India crossed 880 tonnes in official gold reserves by end-2025 — a figure the Reserve Bank of India values at over $100 billion — having added approximately 518 tonnes since 2000. Turkey reached 811 tonnes. The pattern across emerging market central banks is consistent: gold is being treated as a sanction-proof reserve asset in a way that dollar holdings are not. This is de-dollarization expressed not through rhetoric but through vault allocation decisions.
The Structural Anomalies the Treemap Exposes
Two countries expose the limits of what reserve rankings actually measure. Switzerland, ranked seventh with 1,040 tonnes, refines more than 60% of the world's gold despite owning a fraction of it, and holds approximately 115 grams of gold per capita — the highest of any major economy. The US and Germany each hold approximately 69% of their total foreign reserves in gold, a Bretton Woods legacy ratio, while China holds only around 9% and Japan only 5% despite both being top-six holders by volume. Australia holds just 75 tonnes — ranking 41st globally — despite Australia and Russia together accounting for nearly 40% of known in-ground gold reserves worldwide. Africa presents the starkest divergence: the continent produces more than a quarter of the world's gold annually yet holds only approximately 700–738 tonnes in official reserves across all African central banks, roughly 2% of the global total. Most of Africa's gold is mined, refined, vaulted, and traded entirely outside the continent, a structural extraction dynamic the Afreximbank Pan-African Gold Bank initiative — formalised under a memorandum of understanding signed in late 2024 — is explicitly designed to begin addressing.
What Comes Next
Gold above $4,300 per ounce in 2025 reflects a market pricing in sustained institutional demand, geopolitical fragmentation, and continued dollar reserve diversification. The three consecutive years of central bank purchases above 1,000 tonnes are not a cyclical spike; they track a durable shift in how non-Western central banks assess reserve risk. Whether that shift accelerates depends substantially on how the dollar's reserve status evolves under continued US fiscal expansion and BRICS-linked de-dollarization efforts — and on whether China's actual gold accumulation, if official figures eventually reflect analyst estimates, further rebalances the rankings that the treemap currently shows.
One chart like this in your inbox each week, explained in plain English — join the Everything Econ newsletter. Always free, and you can unsubscribe any time.
Take this one home
Get this visualisation as a download, wallpaper, or printed poster.
← Back to all visualisations & articles
Follow Everything Econ: YouTube · TikTok · X · Instagram · Facebook