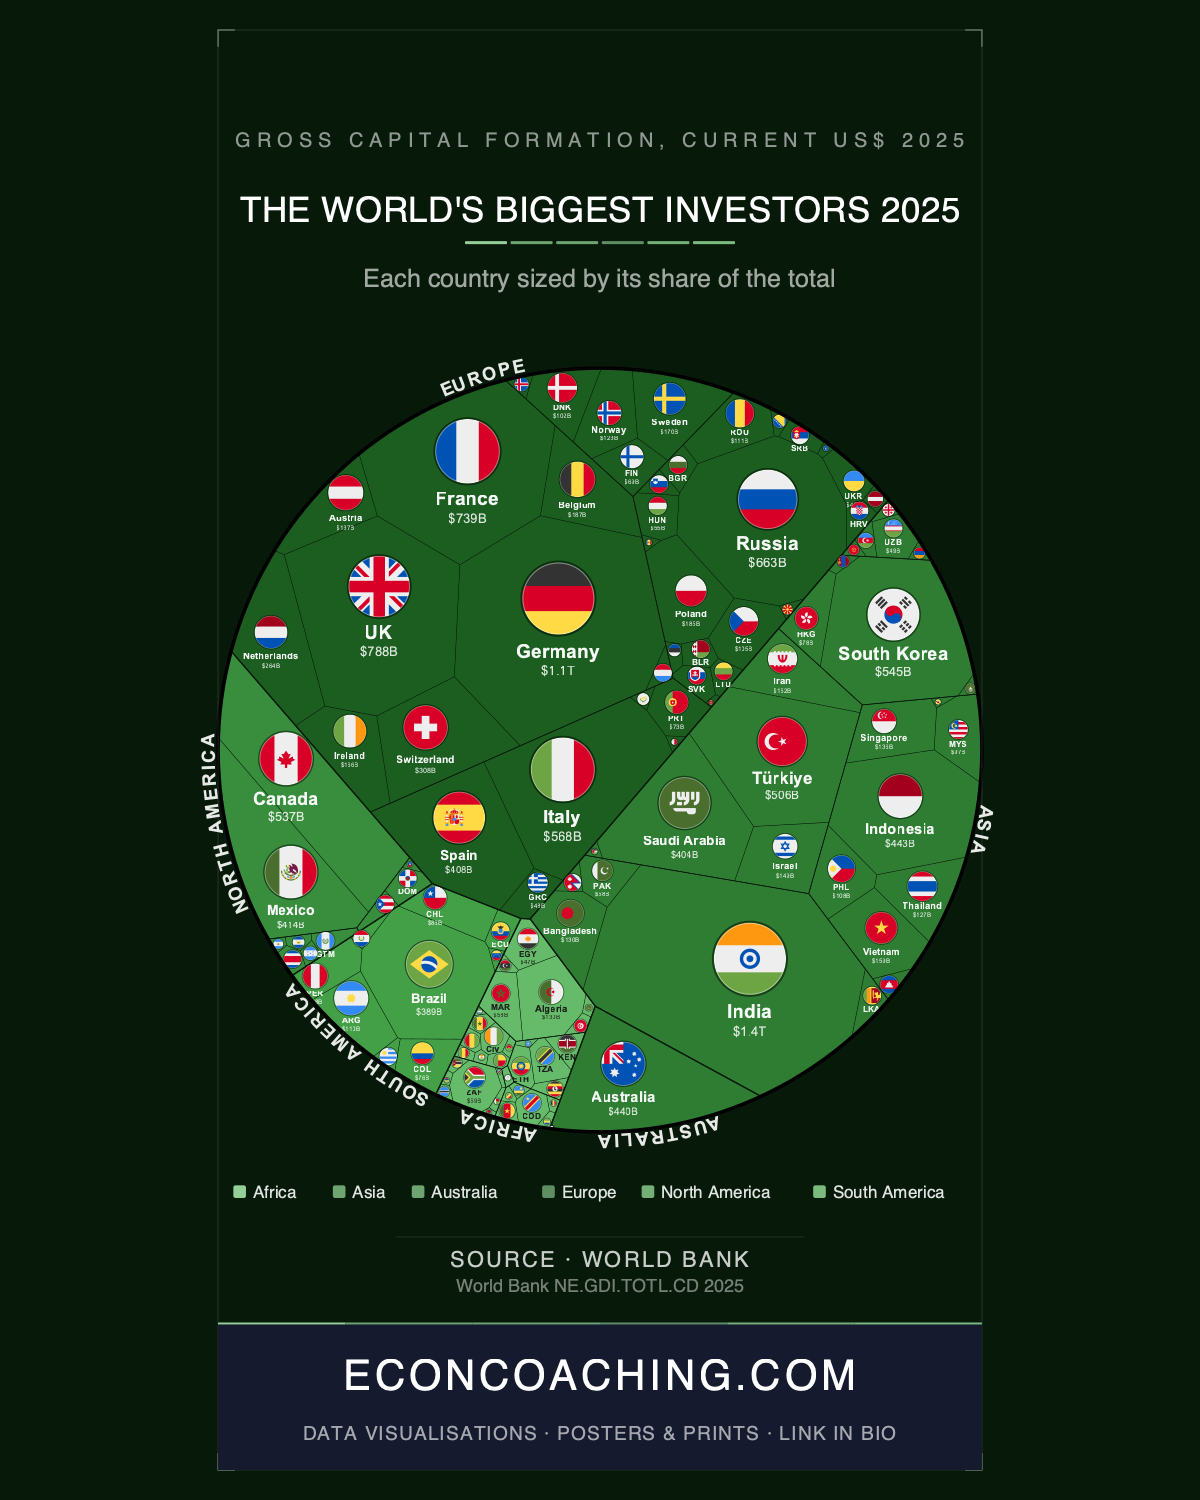
India — a country where per-capita income remains below $3,000 — invested more fixed capital in 2025 than Germany, the United Kingdom, and France combined. At $1.37 trillion in gross fixed capital formation, India ranked first globally, ahead of Germany's $1.11 trillion, the UK's $788 billion, and France's $739 billion. The treemap accompanying this article makes the distortion immediate: India's cell is larger than any European nation's, despite an economy still smaller than Germany's by GDP. That inversion is the defining structural fact in global investment geography for 2025.
India's Lead Is Real, but Its Nature Matters
India's top ranking is not the product of an unusually high investment rate. At approximately 29.6% of GDP in 2024, its gross fixed capital formation as a share of output sits only modestly above the global norm — compared with Türkiye at 30.6% or several Southeast Asian peers running higher ratios. What drives India's absolute lead is scale and momentum: as the world's fourth-largest economy by end-2025, any investment rate near 30% generates enormous absolute volumes. As recently as 2009, India ranked 11th globally by GDP; its climb to the top of the GFCF rankings mirrors that broader ascent, with government capital expenditure programmes providing the primary fuel and early signs of private-sector capex finally joining in Q4 of fiscal year 2024–25, when investment growth hit 9.4% — its strongest quarterly reading in over a year. Per-capita investment, however, remains far below Germany, France, or Australia, meaning the quality and productivity of India's capital stock still trails developed-economy peers by a substantial margin.
Germany: High Rank, Deteriorating Foundation
Germany's position at number two globally — $1.11 trillion — creates a misleading impression of investment health. According to Destatis, the German Federal Statistical Office, gross fixed capital formation fell 0.5% in 2025, marking the fifth consecutive annual decline in construction investment. Business investment in machinery and equipment fell to a 15-year low in early 2025 as German companies absorbed a simultaneous hit from US tariffs, intensifying Chinese industrial competition, and persistently high energy costs. The FDI stock in Germany actually lost 1.2% of its value between 2020 and 2024 — a deterioration more commonly associated with structurally unstable economies than the world's third-largest exporter. Friedrich Merz's government responded in March 2025 by loosening Germany's constitutional debt brake for the first time in its modern form, the most significant fiscal policy shift in decades, though its effect on investment flows will take years to materialise.
Europe's 47% Share Requires a Structural Footnote
Europe as a region accounts for 47.1% of all global investment in the 2025 dataset — more than Asia's 32.6% and North America's 7.5% combined. That figure is striking but requires qualification. A significant portion of European GFCF flows through financial conduit economies — the Netherlands, Belgium, and Luxembourg — where recorded investment reflects balance-sheet structuring and pass-through capital rather than brick-and-mortar productive activity. The headline regional share overstates the depth of Europe's real investment base. UNCTAD's World Investment Report 2025 confirms a similar dynamic in FDI data: global FDI rose 14% in 2025 to $1.6 trillion, but strip out conduit flows and the underlying increase was approximately 5%, with early 2025 project and deal activity at record lows. The FDI headline and the GFCF regional share both flatter the reality.
The Structural Outliers: Türkiye, Algeria, Australia
Three rankings below the top tier carry analytical weight disproportionate to their coverage. Türkiye ranks ninth globally at $506 billion, with GFCF representing 30.6% of GDP in 2025 — a result achieved despite years of high inflation and severe currency volatility that would typically suppress capital formation. Algeria ranks 28th globally at $130 billion, the largest investment total in Africa and sufficient for second place on the Global Attractiveness Index (TEHA) for the continent in 2025, despite inward FDI averaging just 0.4% of GDP over the prior five years. Algeria's investment landscape shifted materially after 2020, when it repealed a restrictive 49/51 foreign ownership law that had deterred foreign capital for over a decade, though hydrocarbon dependency remains a structural vulnerability in its investment base. Australia, at $440 billion and ranked 11th globally, is the sole Oceania nation in the entire top 20 — a data point that gives it geopolitical and economic weight substantially exceeding its population of approximately 27 million.
AI Infrastructure and the New Shape of Capital
The composition of global investment in 2025 has shifted as sharply as its geography. Data centres alone accounted for more than one-fifth of all global greenfield project values in 2025, with announced investment exceeding $270 billion, driven by AI infrastructure demand — a sector that barely registered in investment rankings a decade ago. That concentration came at the direct expense of other asset classes: investment in critical minerals collapsed 63% below 2024 levels, and project finance declined for the fourth consecutive year according to the UNCTAD Global Investment Trends Monitor No. 50. SDG-related investment projects fell another 10%. The 2025 investment cycle is increasingly bifurcated between digital infrastructure attracting capital at scale and physical and development-oriented assets losing it.
The forward trajectory of this inversion will depend on whether India's private sector sustains the capex momentum visible in late fiscal 2024–25, whether Germany's debt-brake loosening translates into real investment recovery, and whether the AI-driven concentration in data centre greenfield spending produces the productivity spillovers that would justify its displacement of other capital categories. The 2025 rankings are a snapshot of a reallocation still in motion.
One chart like this in your inbox each week, explained in plain English — join the Everything Econ newsletter. Always free, and you can unsubscribe any time.
Take this one home
Get this visualisation as a download, wallpaper, or printed poster.
← Back to all visualisations & articles
Follow Everything Econ: YouTube · TikTok · X · Instagram · Facebook