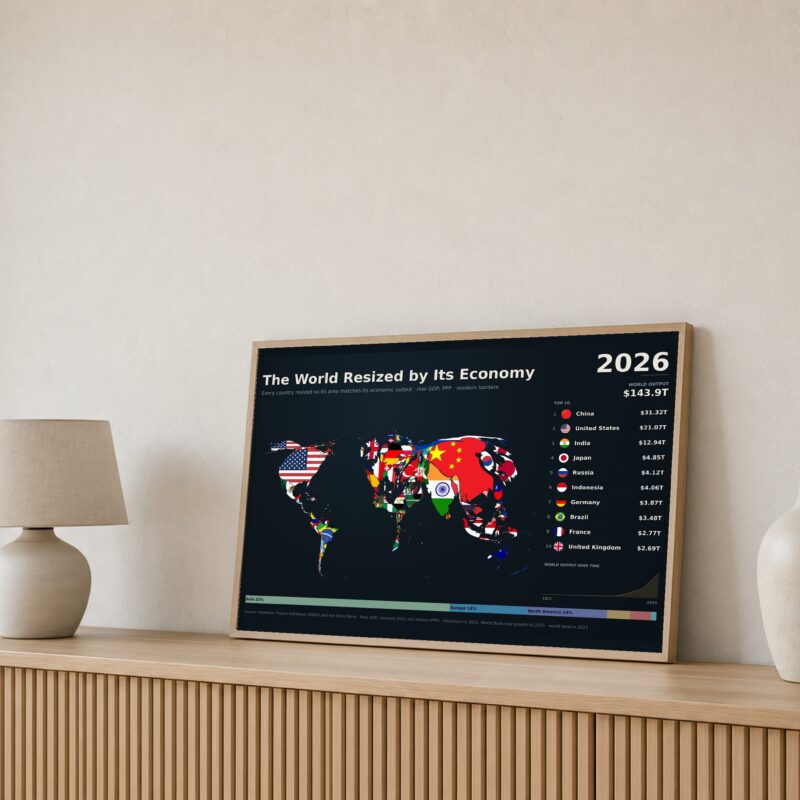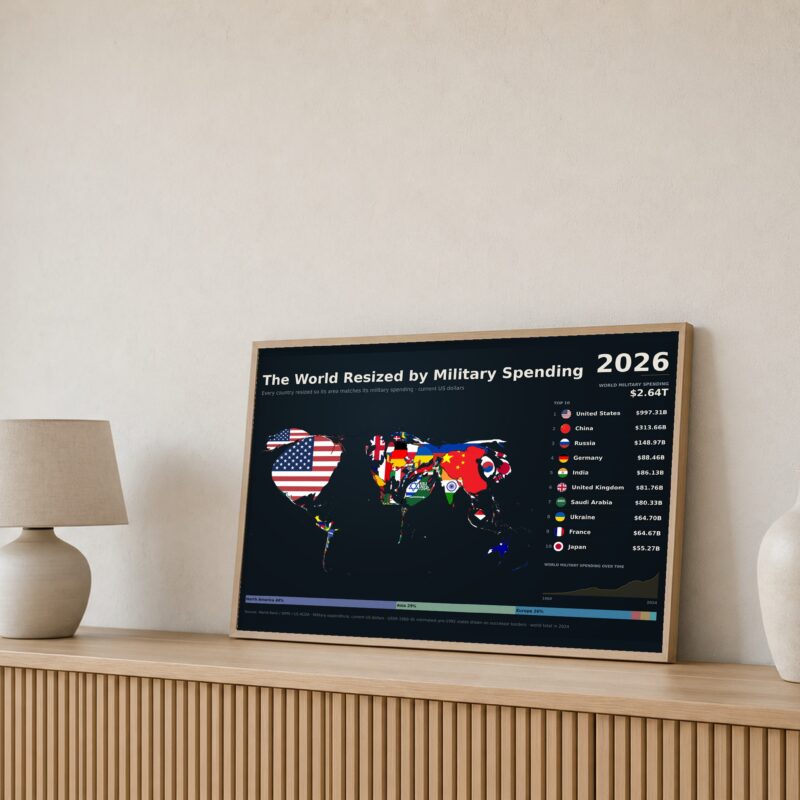
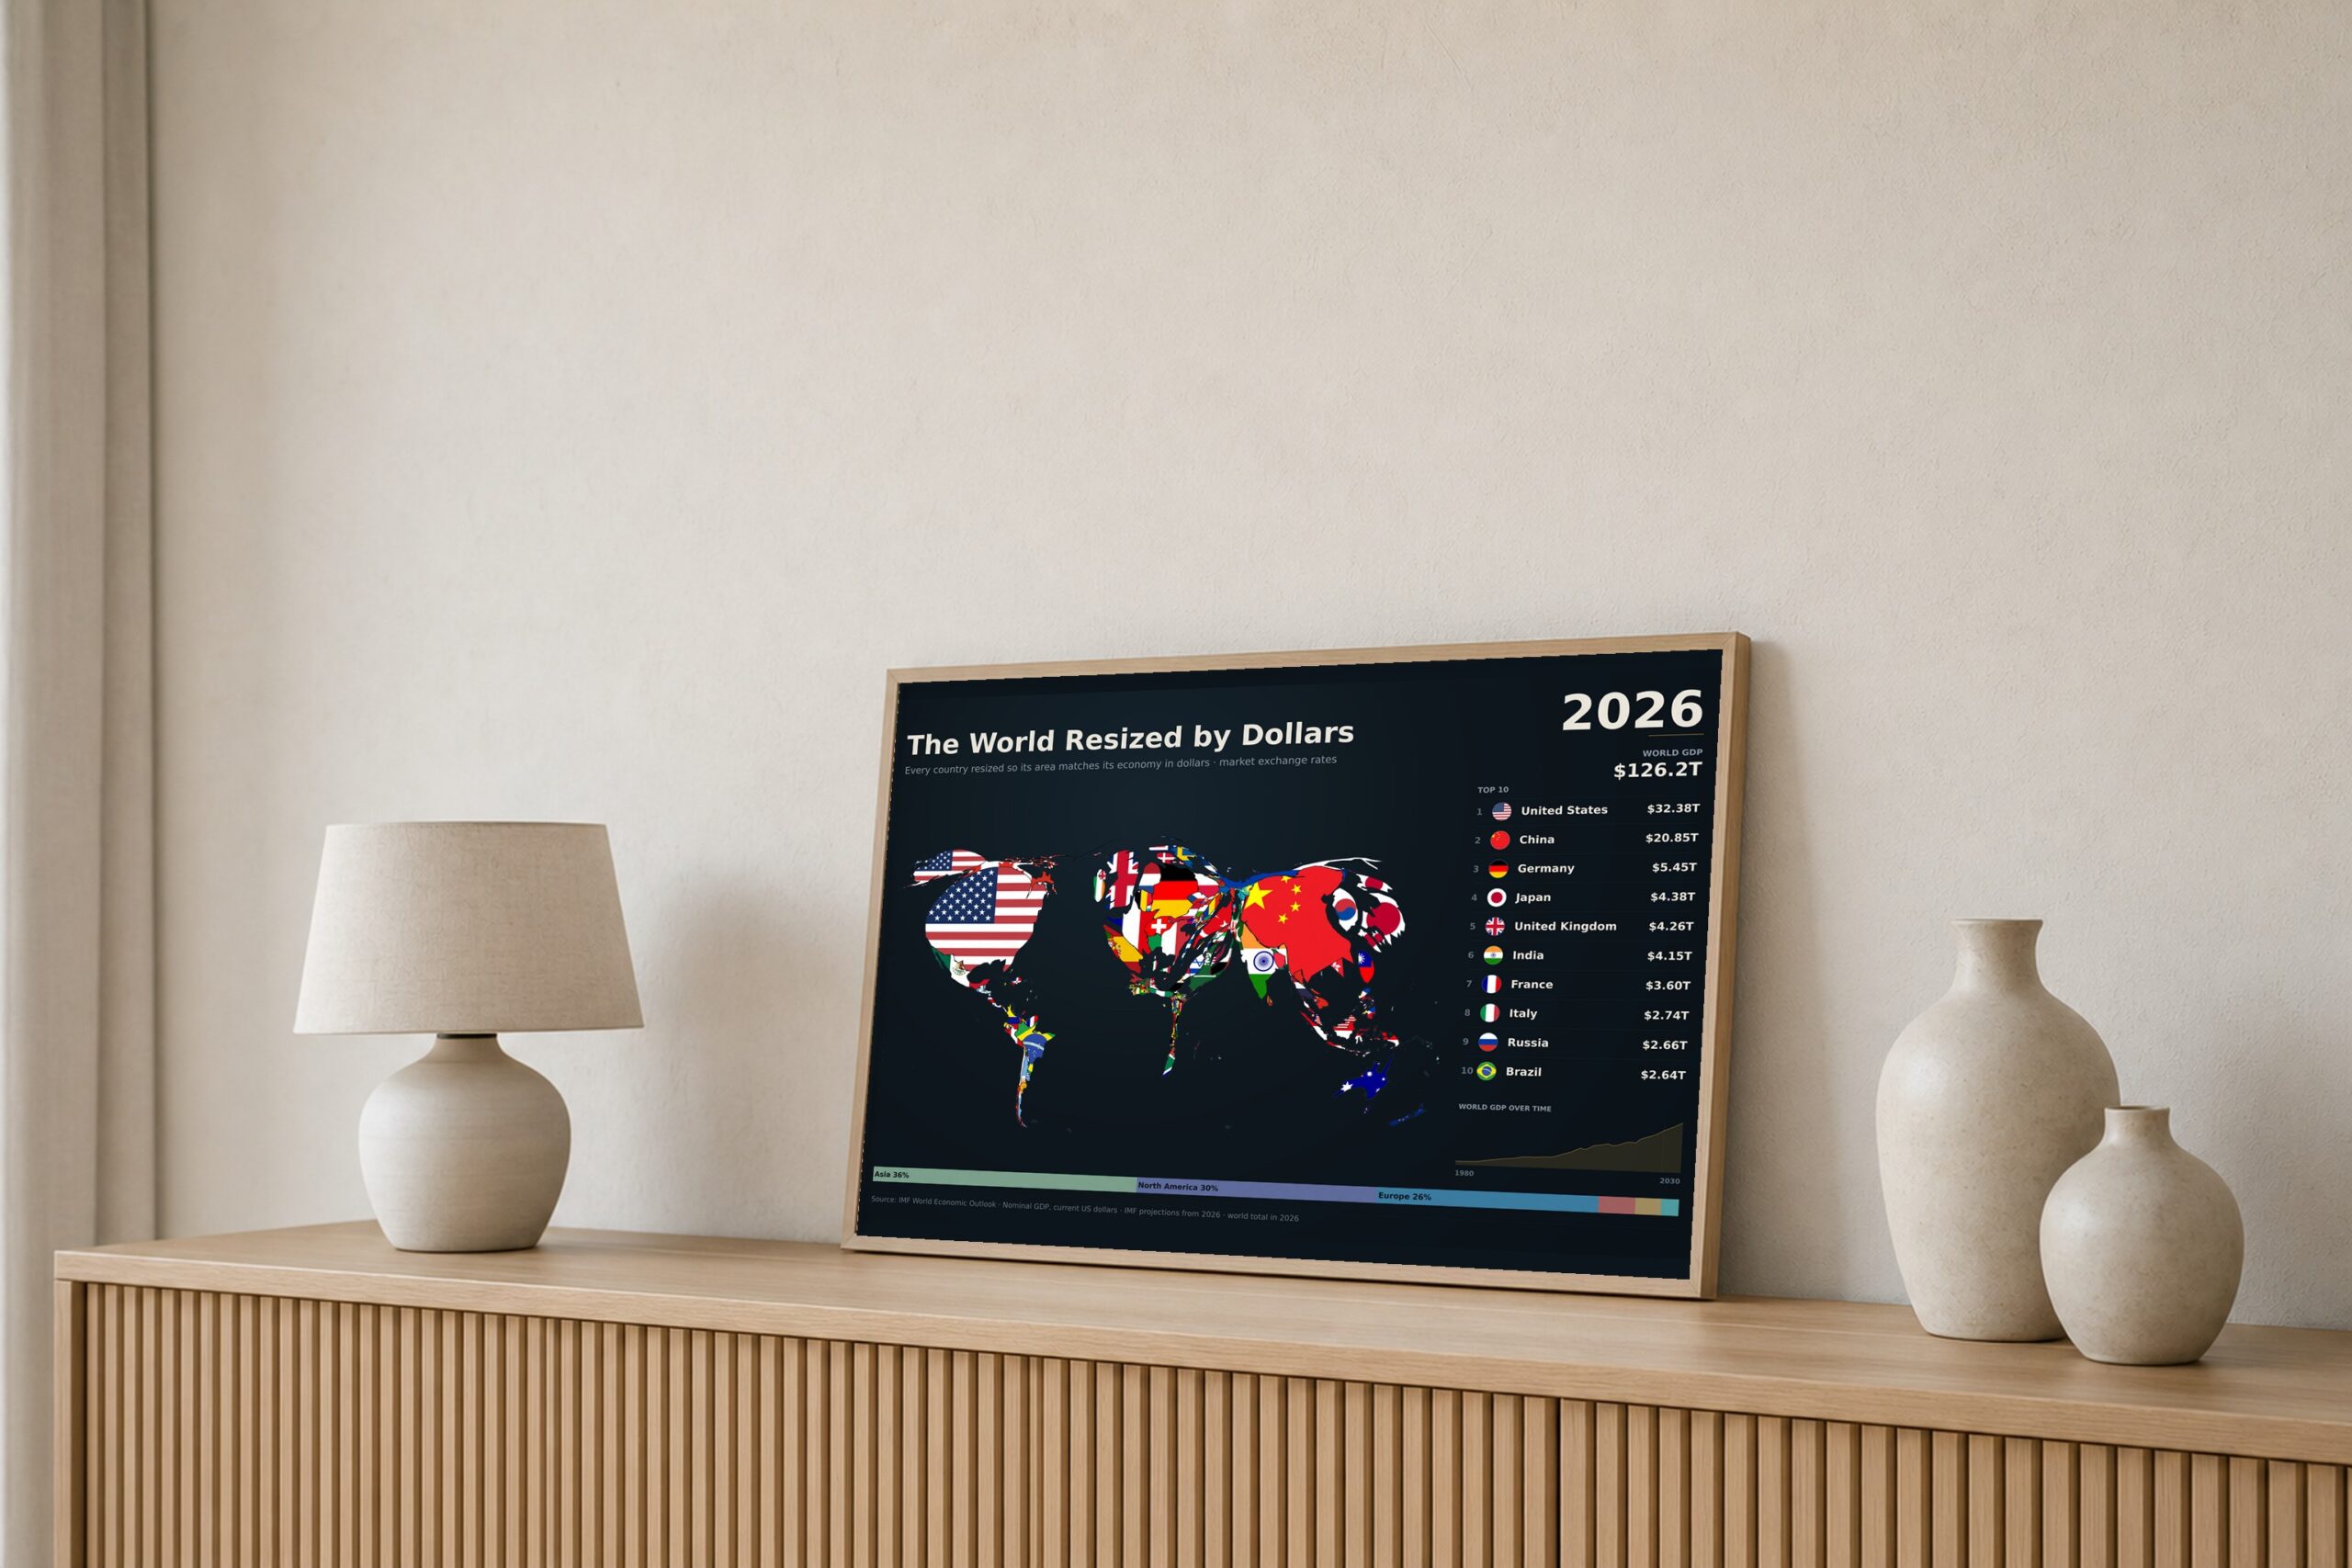
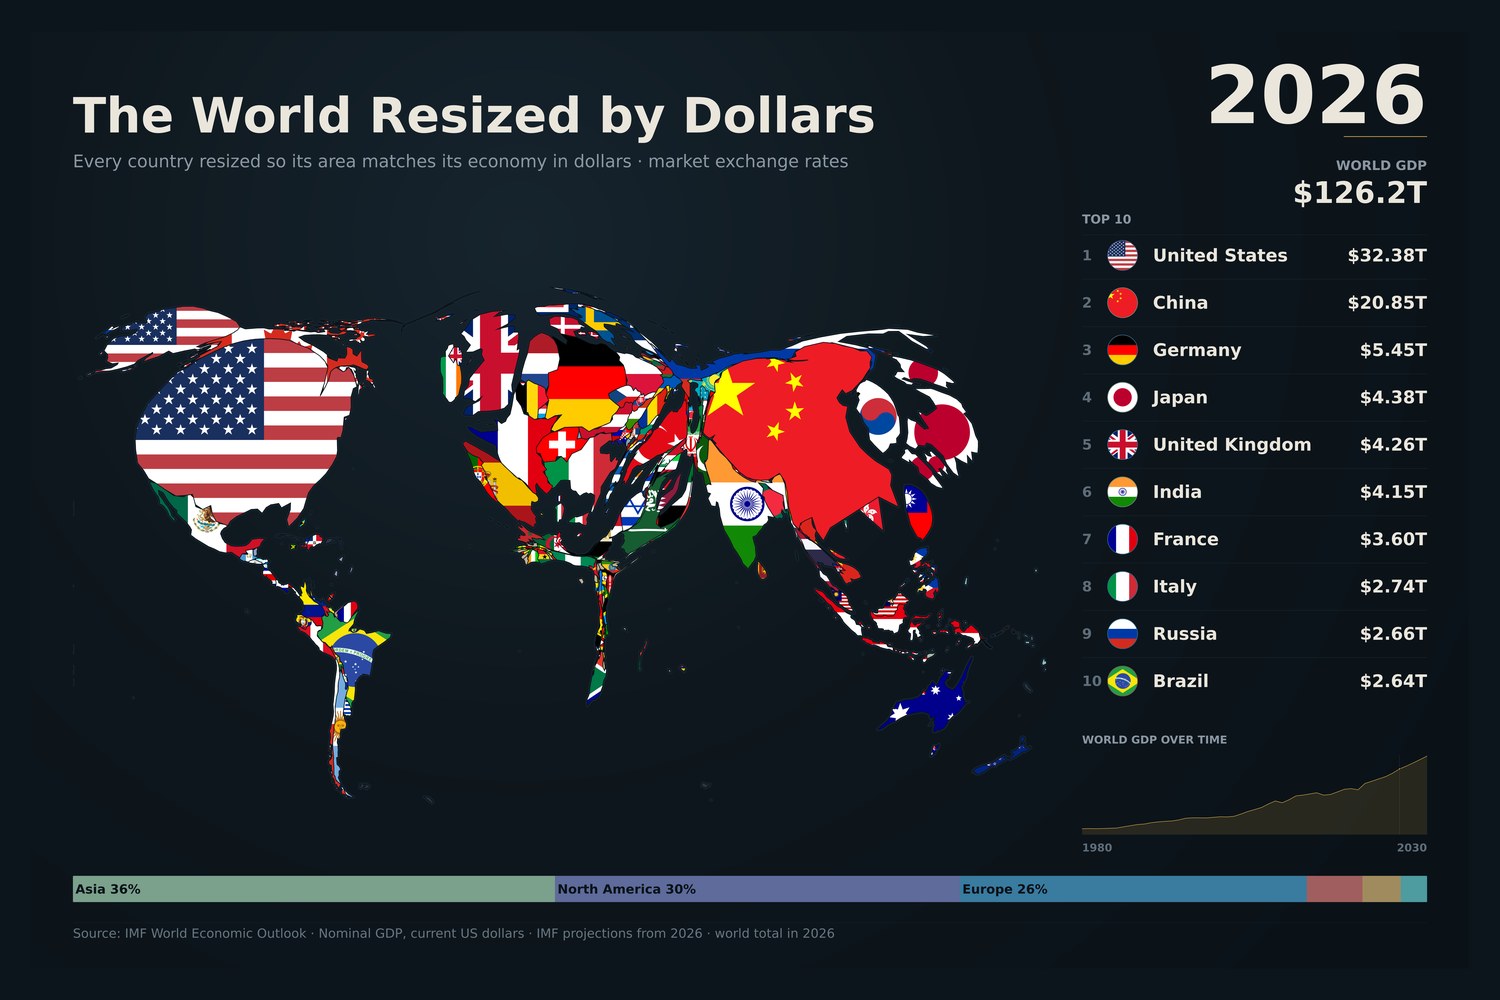
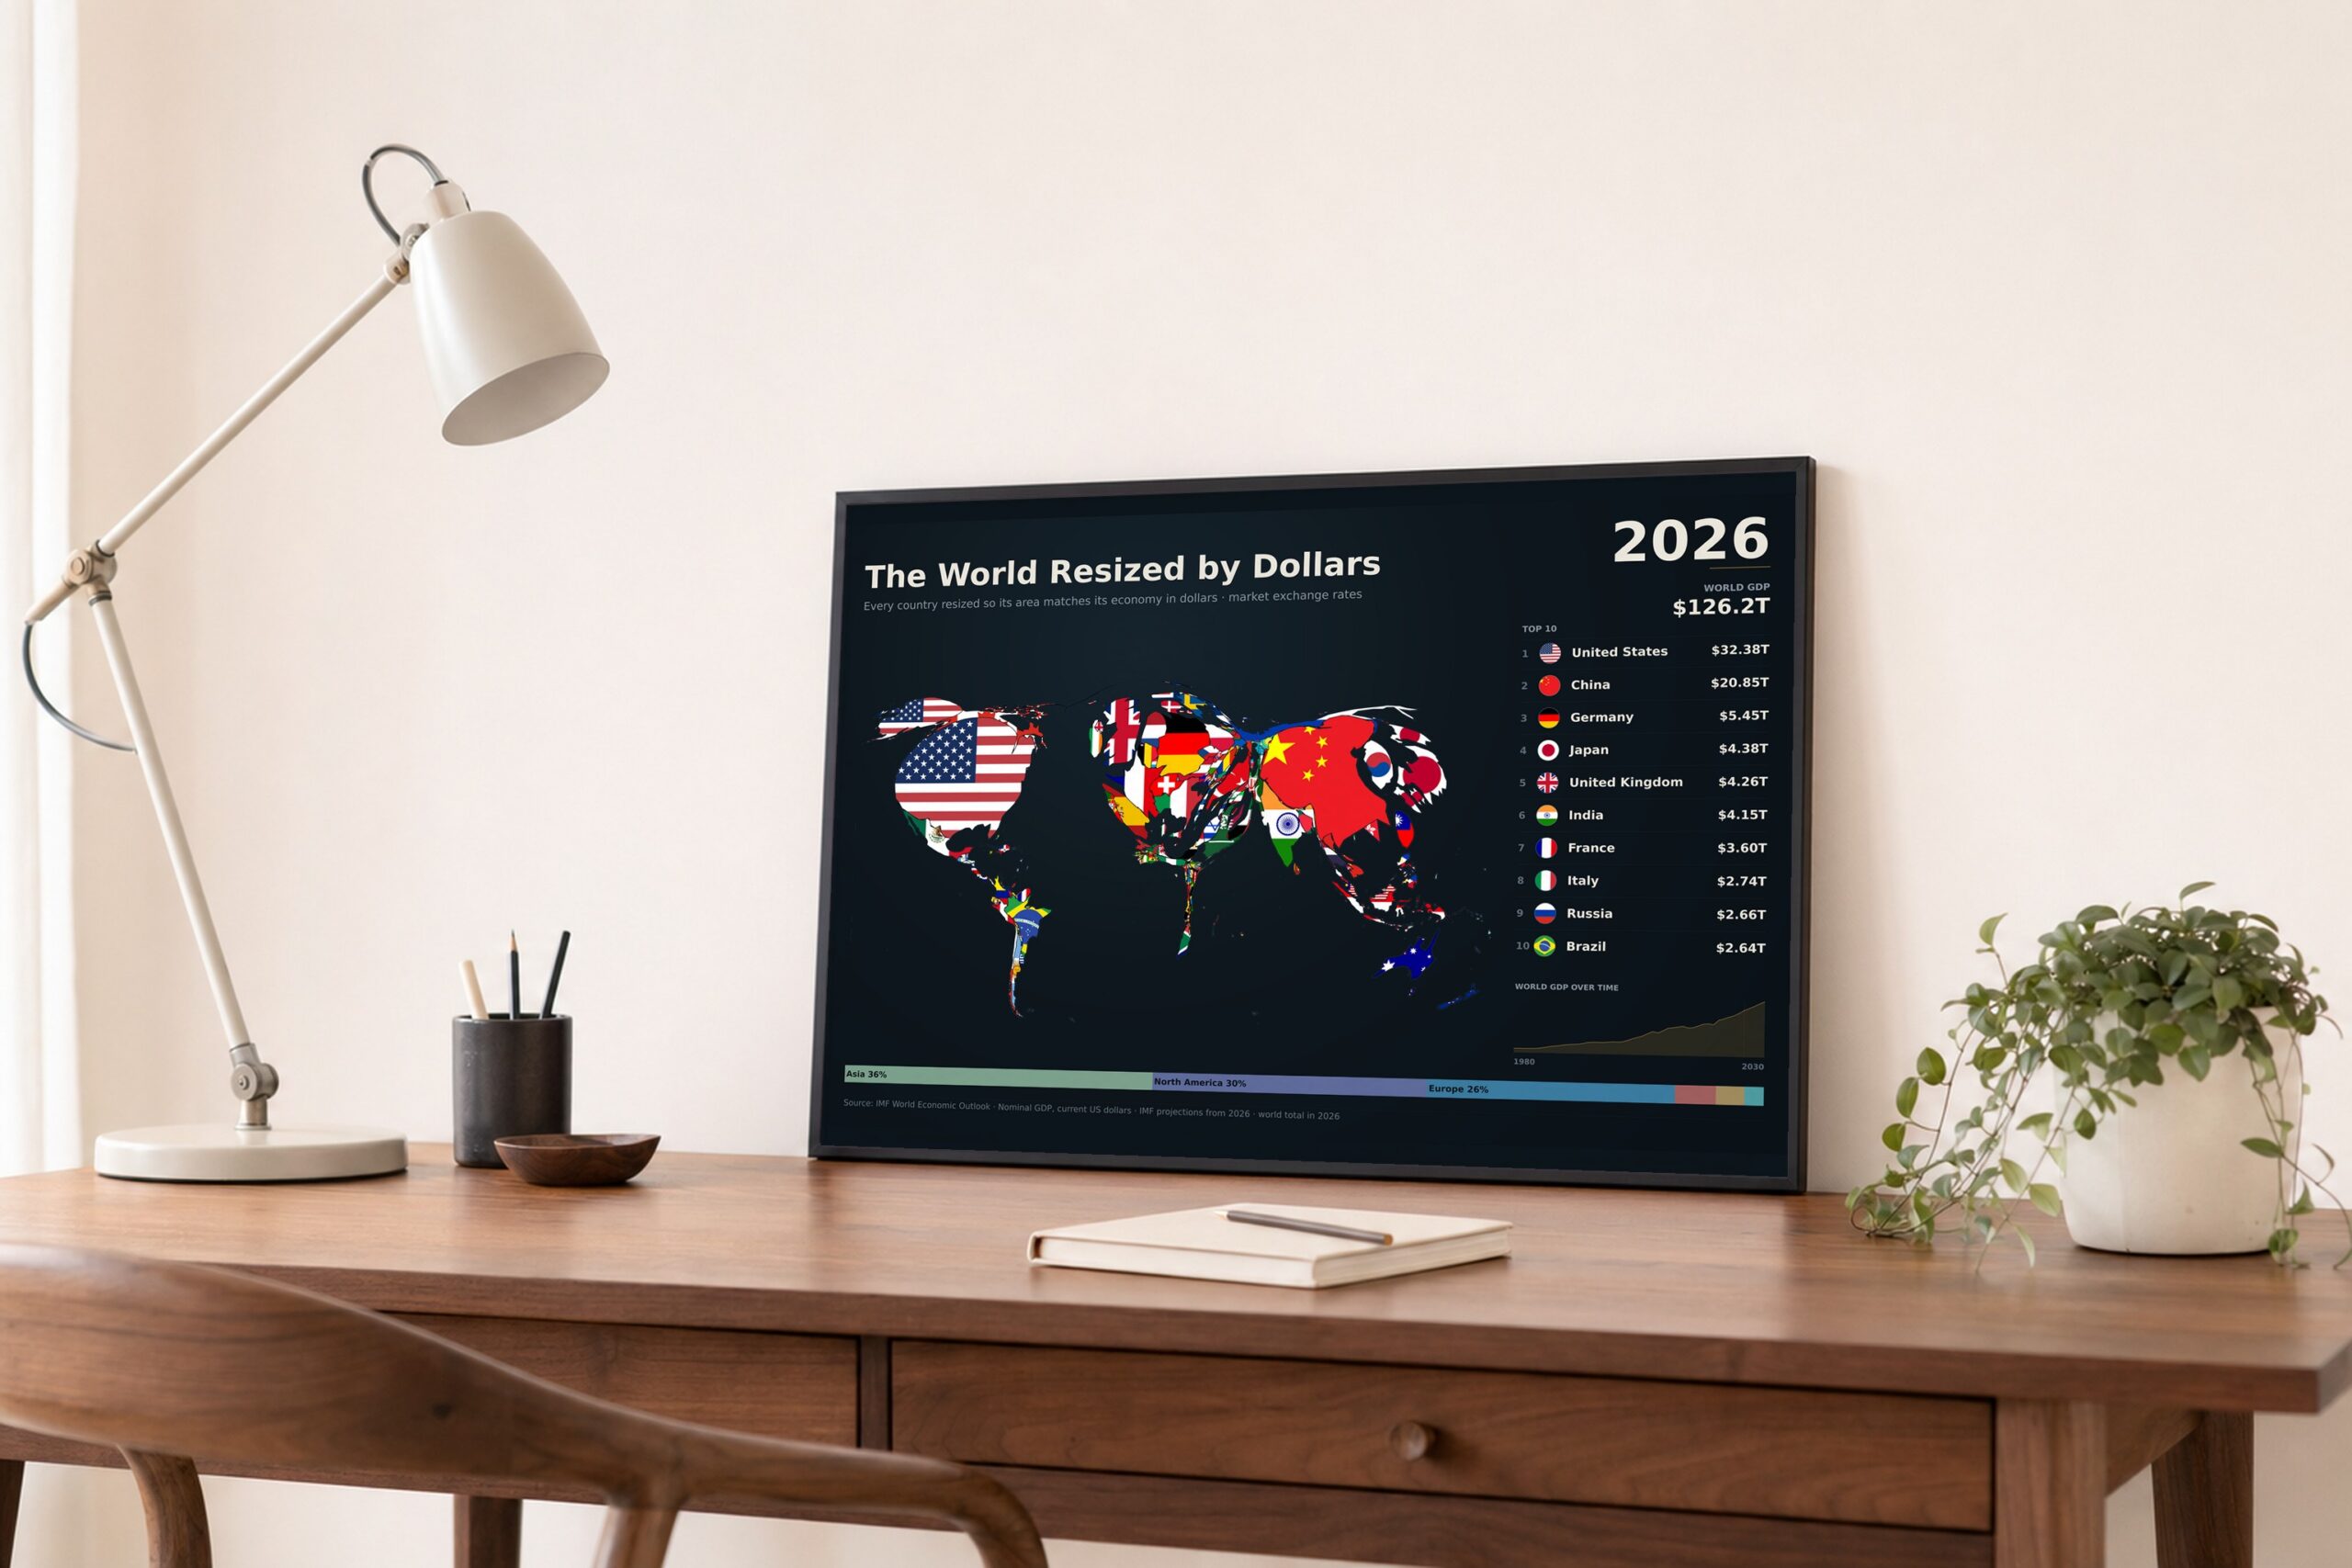
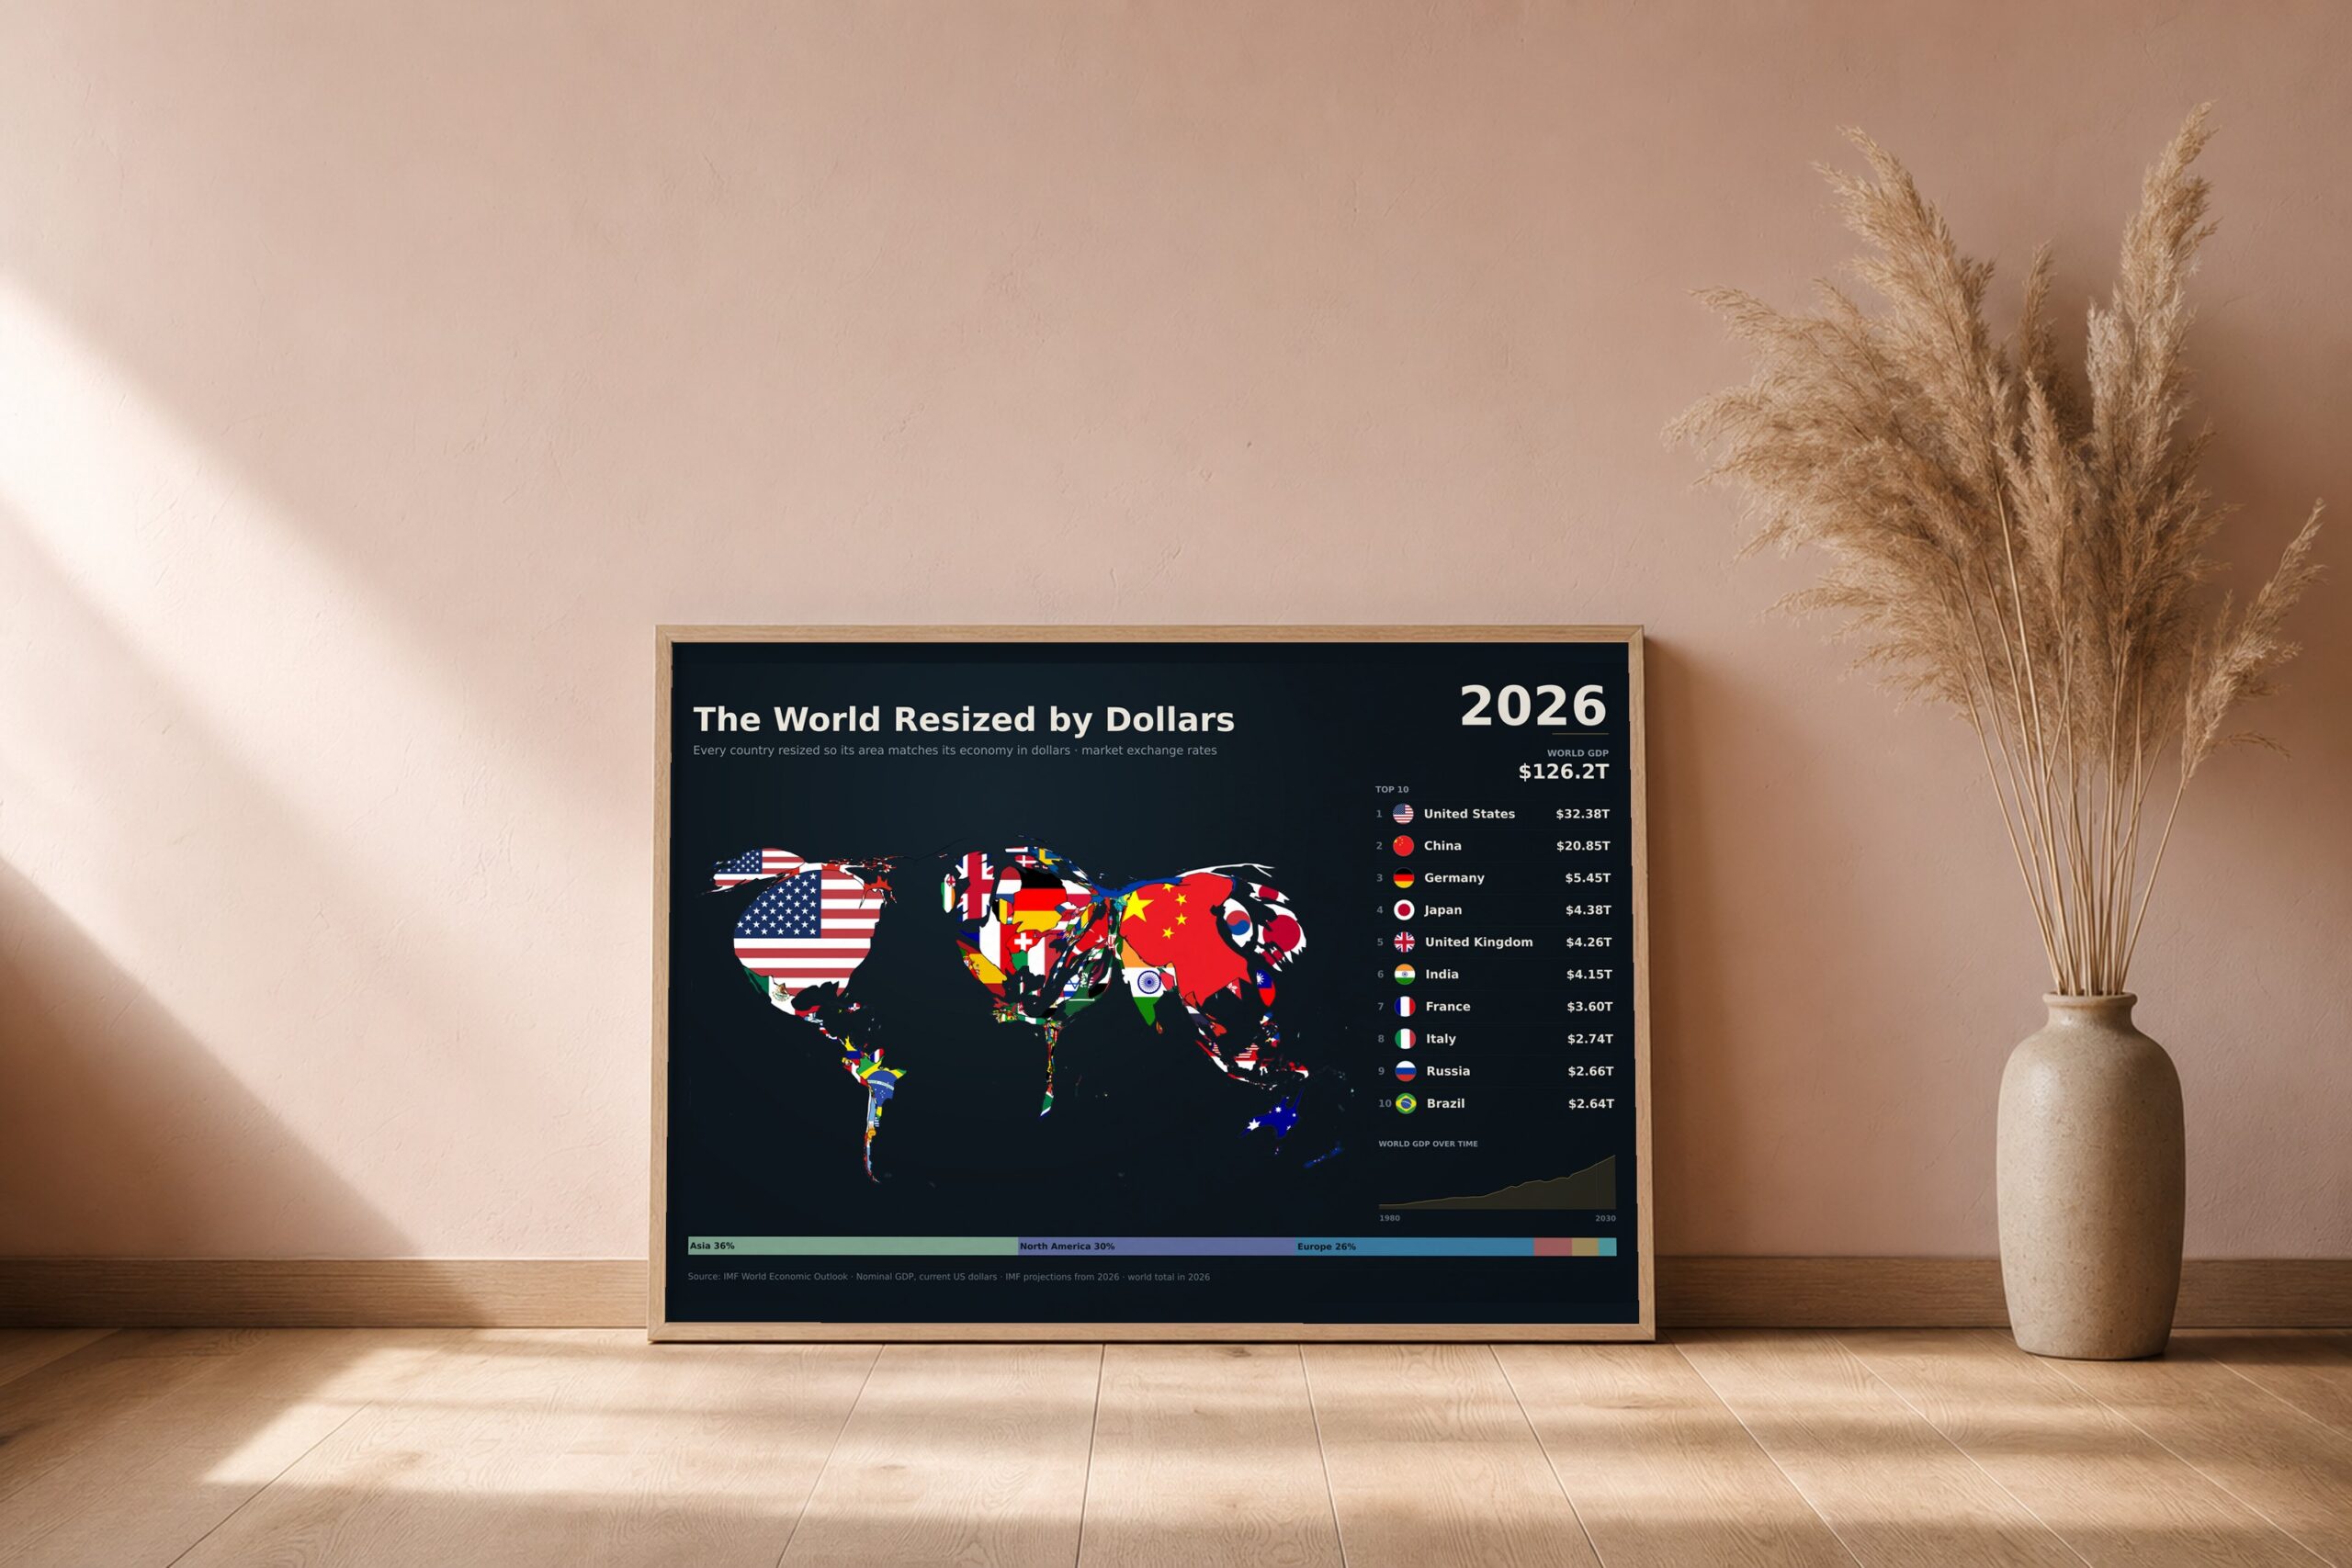
A cartogram: the familiar world map, deformed so that each country is drawn at a size proportional to its nominal GDP in current US dollars. Modern borders.
The United States leads with $32.4tn, ahead of China ($20.9tn), Germany ($5.5tn), Japan ($4.4tn) and the United Kingdom ($4.3tn). The world economy totals $126.2tn. Alongside the map sit the ten largest economies and world GDP since 1980.
What you get: the finished poster at 24×16in, 18×12in and 12×8in (300 dpi PNG), a print-ready PDF, and a short guide to getting it printed well. The print option is a premium matte poster, 16×24in or 12×18in, printed and posted to you.
Data: IMF World Economic Outlook. 2026 figures are IMF estimates.