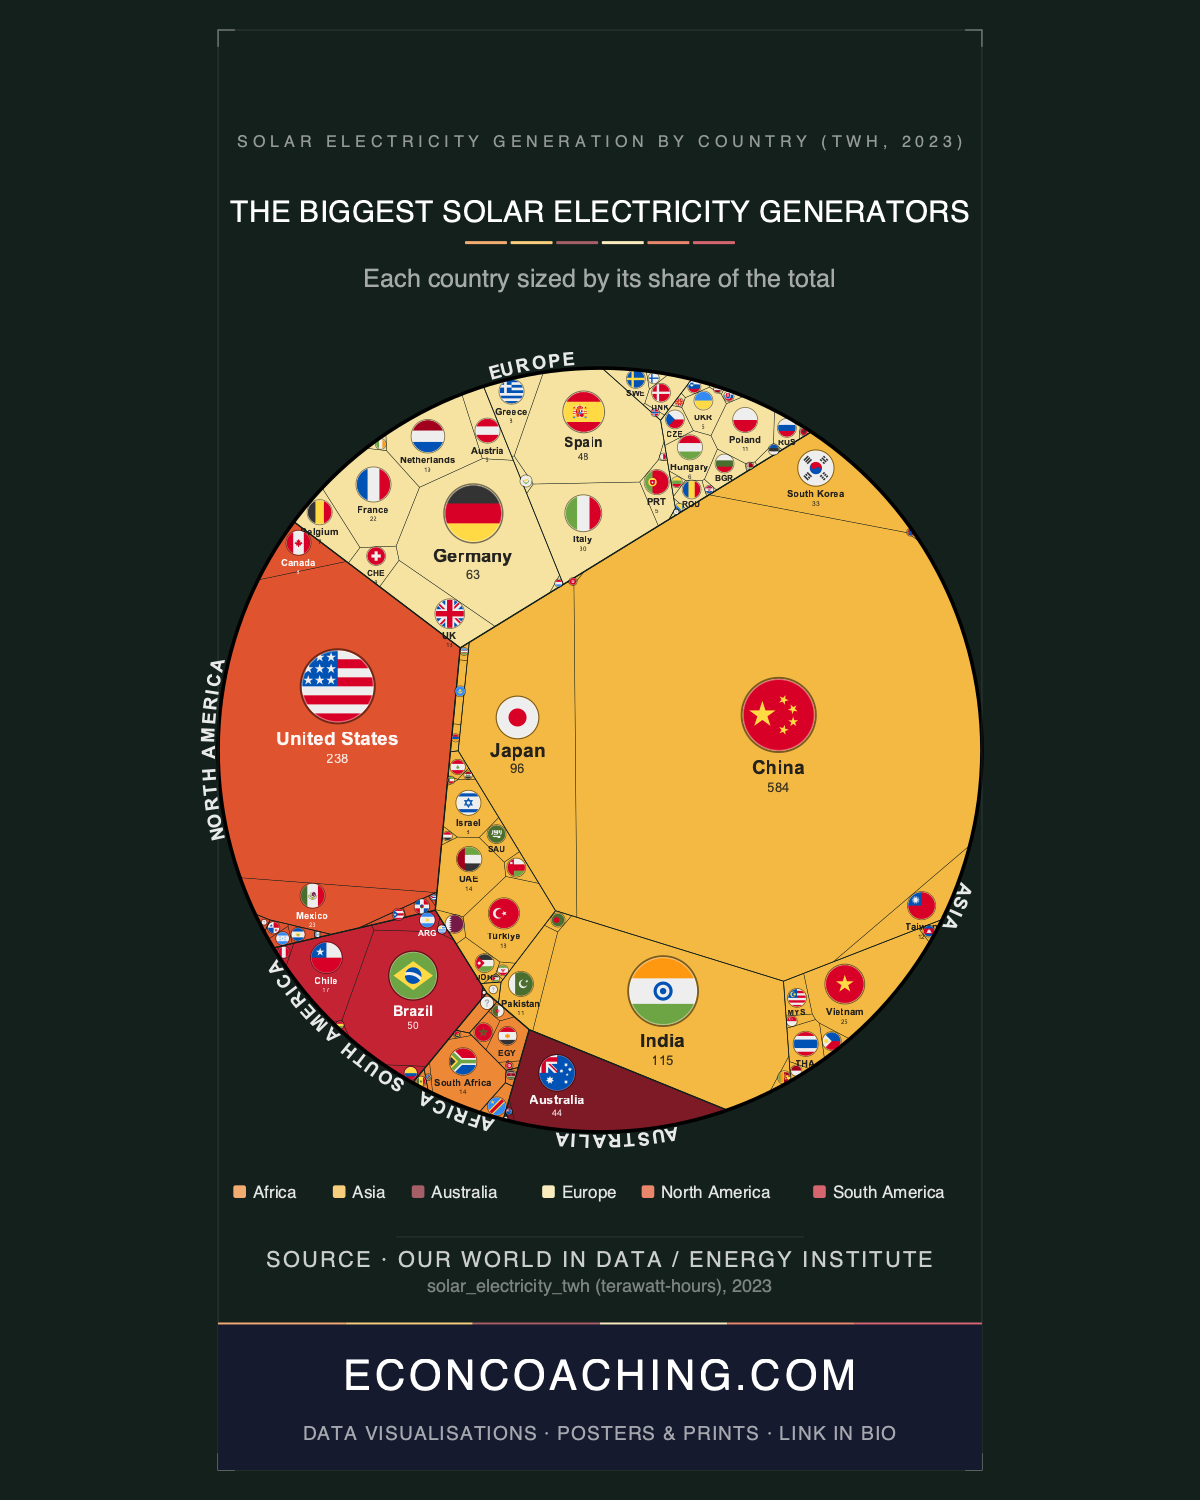
China generated 584 TWh of solar electricity in 2023 — more than Europe (282 TWh) and North America (277 TWh) combined. In the treemap accompanying this article, where cell area is proportional to generation rather than land mass, China's block consumes more than a third of the entire chart, compressing the US, Germany, Japan, and India into shapes that look, by comparison, marginal. The distortion reflects a real and structurally significant concentration of solar energy production in a single country.
China's Dominance Is Not Just About Scale — It Is About Speed
At 35.14% of global solar output, China's share is nearly 2.5 times the US share of 14.37%. India at 6.93%, Japan at 5.78%, and Germany at 3.84% follow at considerable distance. The absolute figures still understate the degree of divergence, because China's dominance is not merely cumulative — it reflects a single-year installation record that reshapes the trajectory of global solar. In 2023, China added approximately 217–260 GW of new solar capacity in a single calendar year, more than the rest of the world combined installed that year, and roughly equivalent to deploying the entire existing US solar fleet in twelve months. China's 584 TWh, it should be noted, represented only about 6–8% of its own enormous total electricity consumption — meaning that even at 35% of the world's solar output, solar remains a modest share of China's national grid. High absolute generation does not automatically mean high penetration.
Policy Drives Solar More Than Sunshine Does
Germany occupies fifth position globally at 64 TWh — 3.84% of global solar output — despite annual sunlight levels roughly comparable to Alaska. The explanation is institutional rather than meteorological. In 2000, Germany passed the Renewable Energy Act (EEG), the world's first large-scale solar feed-in tariff, guaranteeing above-market electricity prices for 20 years. Germany subsequently deployed more than 10 times as much solar as California in the decade 2002–2012, despite 70% worse solar irradiance, establishing the policy template that China, Vietnam, Japan, and over 100 other countries later adopted. The global solar boom visible in 2023 data is, in a direct and traceable sense, a product of a German legislative decision made in 2000.
Vietnam demonstrates the same dynamic with more recent evidence. In 2010, Vietnam ranked approximately 196th in the world for solar capacity; by 2023 it had reached eleventh globally at 26 TWh, overtaking France, the Netherlands, and Mexico within a five-year window. That trajectory was driven almost entirely by a 2017 Feed-in Tariff of $93.5/MWh for 20 years — the most generous in Southeast Asia at the time — which triggered a deployment surge that made Vietnam responsible for roughly two-thirds of ASEAN's total solar and wind generation by 2023. Brazil's parallel story is equally striking: its solar PV generation grew more than 4,300 times over the prior decade, vaulting the country to sixth globally at 51 TWh, with solar surpassing wind to become Brazil's second-largest electricity source behind hydropower.
The Per-Capita Inversion
Australia ranks eighth globally in absolute terms at 45 TWh — with a population of approximately 26 million, giving it solar output of roughly 1.7 TWh per million people, among the highest per-capita rates of any major solar nation. By 2023, more than one in three Australian households had rooftop solar panels, a world-first milestone that reflects a genuinely distinct diffusion model: Australia's solar rise was driven primarily by millions of individual household decisions rather than utility-scale projects. Germany, the Netherlands, and Spain similarly rank far above China and India when generation is divided by population. China's per-capita rate of approximately 0.42 TWh per million people is a fraction of Australia's, which suggests that the absolute ranking captures manufacturing and installation capacity more than it captures how deeply solar has penetrated daily energy consumption across a society.
Africa's Structural Gap
The entire African continent generated 30 TWh of solar electricity in 2023 — 1.8% of the world total — despite Africa receiving roughly 40% of global solar irradiation. Africa's theoretical solar resource is estimated at 60,000,000 TWh per year; the continent generated less solar electricity than Brazil alone. South Africa accounted for 15 TWh, exactly half of the continent's total output, with no other African nation exceeding 5 TWh — Egypt was second at 5 TWh. The 1.8% share measures capital scarcity, grid infrastructure deficits, and historically limited policy support rather than resource constraint. Ember identified 2023 as the first year showing a clear take-off signal for African solar, with South Africa importing a record 4.3 GW of solar panels — a consumer-led boom driven by severe electricity blackouts rather than utility planning. Egypt, Morocco, Saudi Arabia, and Kazakhstan all have large-scale solar projects under construction, and the regional rankings visible today are unlikely to hold through the end of this decade.
The 2023 Threshold and What Comes Next
Global solar electricity generation reached approximately 1,662 TWh in 2023, representing roughly 4.6% of global electricity demand — up from less than 0.1% in 2010, a 46-fold increase in share within 13 years. Solar PV accounted for around 70% of all new renewable electricity generation added in 2023, and global renewable capacity additions were nearly 50% higher than in 2022. Asia as a whole generated 954 TWh — 57.4% of global solar — and even stripping China out, the remaining Asian nations produced 370 TWh, more than all of Europe at 282 TWh, underscoring that Asia's solar dominance is not a one-country story. The 2023 data is the first full year in which China's installation record, the US Inflation Reduction Act's North American stimulus, Europe's post-Ukraine energy security investment, and Southeast Asia's feed-in tariff deployments all appear simultaneously in the generation figures. The countries absent from the top of this ranking — above all the African nations sitting on the world's largest untapped solar resource — represent the primary open variable in where global solar generation goes from here.
One chart like this in your inbox each week, explained in plain English — join the Everything Econ newsletter. Always free, and you can unsubscribe any time.
Take this one home
Get this visualisation as a download, wallpaper, or printed poster.
← Back to all visualisations & articles
Follow Everything Econ: YouTube · TikTok · X · Instagram · Facebook