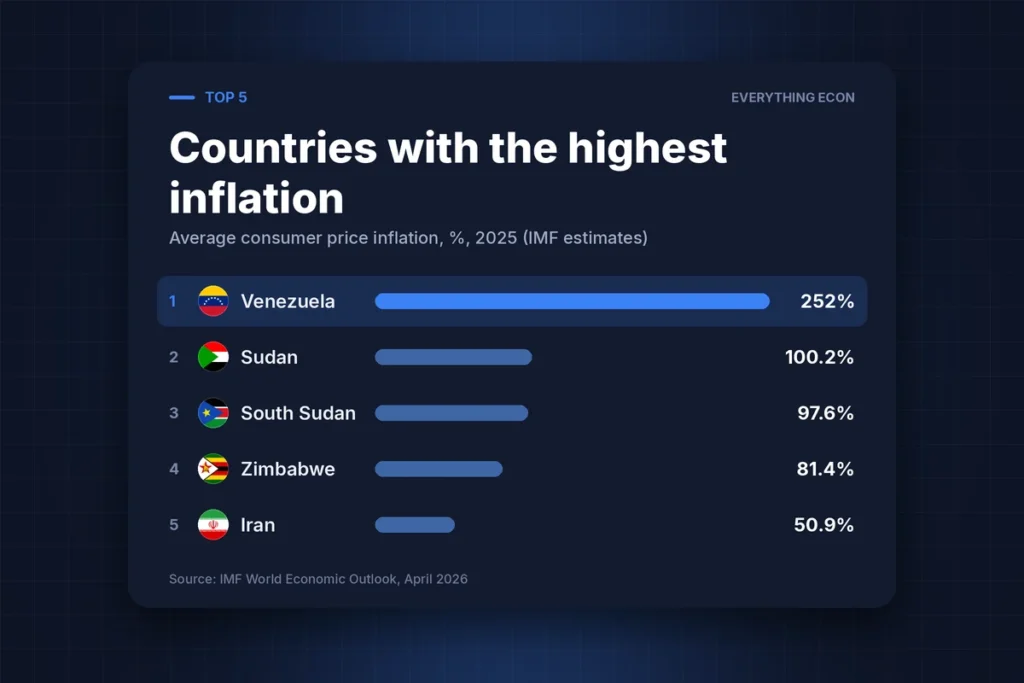
Venezuela’s consumer prices rose by an average of 252% in 2025, according to the IMF’s April 2026 World Economic Outlook, and the Fund projects 387% for 2026. Headline consumer price inflation measures the yearly change in the cost of a typical household’s basket of goods and services. Unless stated otherwise, the figures below are IMF annual averages for 2025, the latest full year. At these rates savings and wages lose their value within months, whereas most central banks aim for about 2%. Only five economies ran above 50% in 2025.
At a glance · Top 5
Average consumer price inflation, %, 2025 (IMF estimates)
- 1Venezuela252%
- 2Sudan100.2%
- 3South Sudan97.6%
- 4Zimbabwe81.4%
- 5Iran50.9%
Source: IMF World Economic Outlook, April 2026
The five economies above 50%
Behind Venezuela come Sudan (100.2%), South Sudan (97.6%), Zimbabwe (81.4%) and Iran (50.9%). Argentina (41.9%), Türkiye (34.9%), Burundi (34.2%), Malawi (28.4%) and Haiti (28.3%) complete the top ten. Venezuela is a repeat offender: the IMF puts its 2018 average at 65,374%. The Fund also warns that Venezuelan projections are hard to make, because it last held a formal consultation with the authorities in 2004 and reported statistics are limited, so treat the figure as an estimate.
The mechanism is broadly the same across the cluster. A government at war, under sanctions or shut out of borrowing pays its bills by creating money, the currency falls, and imported fuel and food cost more in local terms. Sudan has been in civil war since April 2023, and its inflation ran at 185.7% in 2024 before easing to 100.2%. Zimbabwe swapped its dollar for a new currency, the Zimbabwe gold, in April 2024; average inflation was 736.1% that year, 81.4% in 2025, and the IMF projects 8.0% for 2026. Iran is heading the other way, from 32.5% in 2024 to 50.9% in 2025 and a projected 68.9% in 2026.
Argentina and Türkiye: falling, but not fixed
Argentina’s average inflation fell from 219.9% in 2024 to 41.9% in 2025, and the IMF expects 30.4% in 2026. The national statistics office, INDEC, reported prices up 1.7% in August 2026 and 33.5% on a year earlier. Türkiye followed a similar path, from 58.5% in 2024 to 34.9% in 2025 and a projected 28.6% in 2026.
The surprise in the projections is Bolivia. Its inflation averaged 2.6% in 2023 and 5.1% in 2024, then 19.5% in 2025, and the IMF projects 20.7% for 2026, which would make it the ninth highest in the world. Tables of this kind change faster than most people expect.
How many countries are back near 2%
Of the 194 economies in the IMF’s dataset, 36 averaged between 1.5% and 2.5% in 2025, and another 47 came in below 1.5%, so 83 were at or below 2.5%. A total of 148 were under 5%, and the median was 3.0%. Twenty-four economies were above 10%.
The recovery is stalling. For 2026 the IMF counts 45 economies in the 1.5% to 2.5% band but only 12 below it, and the median rises to 3.3%. Its global headline inflation forecast goes from 4.1% in 2025 to 4.4% in 2026, which it attributes to higher energy and food prices, before falling to 3.7% in 2027.
Where the UK, US and eurozone sit
On IMF annual averages for 2025, the United Kingdom recorded 3.4%, the United States 2.7% and the euro area 2.1%. For 2026 the April forecasts were 3.2%, 3.2% and 2.6% respectively. Monthly readings have since moved higher in places. UK CPI was 3.1% in the 12 months to August 2026 (ONS), US CPI was 3.4% (BLS), and Eurostat’s flash estimate for the euro area was 3.3%, with energy prices up 14.3% on a year earlier.
All three sit above the 2% targets, yet the gap is measured in single percentage points. In the top cluster, prices are multiplying: at Sudan’s 2025 rate, the cost of a basket would double in about a year.
Source: IMF World Economic Outlook, April 2026 (average consumer price inflation, 2025 estimates and 2026 projections; Statistical Appendix Tables A6 and A7). Latest monthly readings: INDEC (Argentina, August 2026), ONS (UK, August 2026), US Bureau of Labor Statistics (August 2026), Eurostat (euro area flash estimate, August 2026).
Get a new data story like this every week — join the newsletter.
Browse every visualisation on the visualisations page.