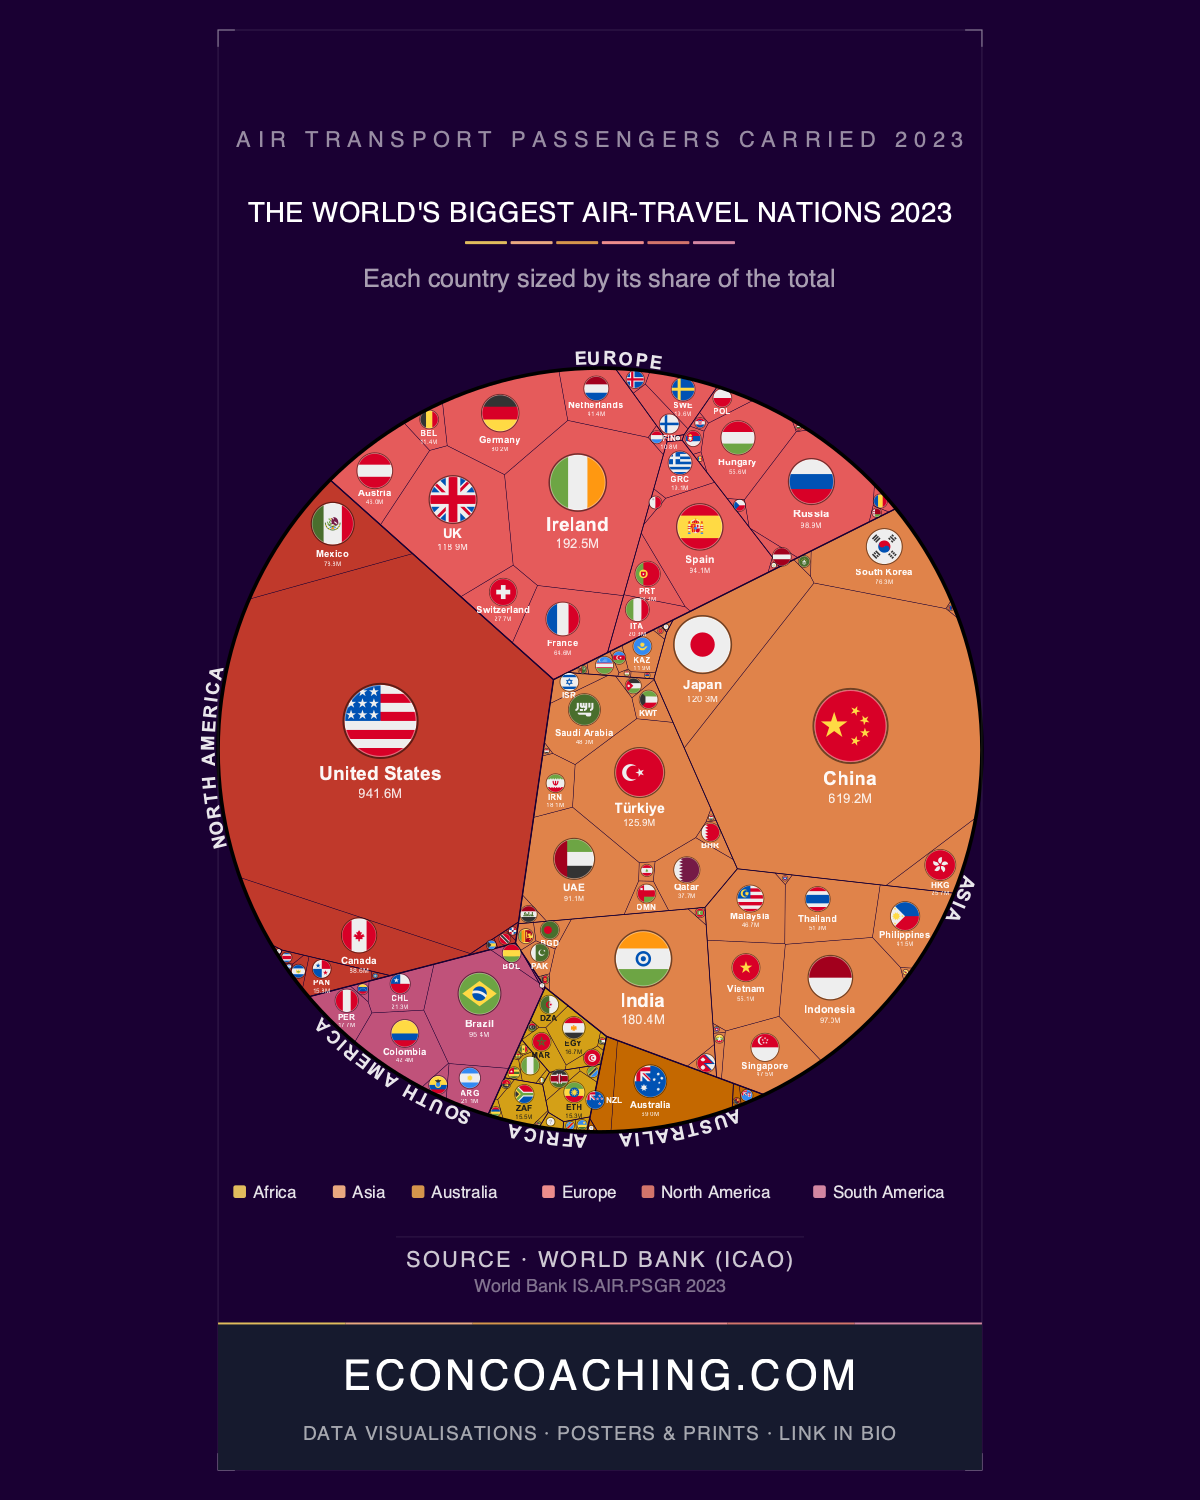
Ireland, a country of five million people, ranks third in the world for air passengers carried in 2023, ahead of India with 1.4 billion. The World Bank figure assigns Ireland 192.5 million passengers against India's 180.4 million — a comparison that makes no geographic or demographic sense until you understand what the metric actually counts. The World Bank and ICAO attribute passengers to the country where an airline is registered, not to the airports the passengers use. Ryanair, headquartered in Dublin, carried over 180 million passengers across Europe in 2023. Almost every one of those passengers is counted as Ireland's in the national statistics, even though the overwhelming majority never set foot in the country. The treemap accompanying this article, where cell area is proportional to passengers carried rather than land area or population, makes the distortion impossible to ignore: Ireland's block sits larger than India's, between a United States rectangle consuming 22% of the chart and a China block occupying 14.5%.
What the Metric Measures — and What It Misses
Ireland's actual airport passenger throughput in 2023 was 39.2 million — a record since Ireland's Central Statistics Office began tracking in 2013, and roughly 20% above 2022 — but still only about 20% of its World Bank-reported 192.5 million. The gap between those two numbers is Ryanair's European operation, scattered across airports in Spain, Germany, Italy, Poland, and dozens of other countries. Hungary produces a structurally identical distortion at smaller scale: ranked 19th globally with 55.6 million passengers, it dramatically outranks what a population of 10 million would suggest because Wizz Air, headquartered in Budapest, flew roughly 100 new routes in 2023 and posted a 32% passenger increase versus 2022. The UAE (91.1 million, rank 12) and Qatar (37.7 million, rank 29) together recorded 128.8 million passengers — more than the UK's 118.9 million — despite a combined national population under four million, because Emirates, Etihad, and Qatar Airways function as global transit carriers whose traffic accrues to their registration countries. Any cross-country comparison using this dataset requires this structural caveat: what is being measured is where airlines are incorporated, not where air travel is actually happening.
The Real Constraint at Dublin Airport
The domestic picture inside Ireland adds a different layer of analytical interest. Dublin Airport operated under a hard passenger cap of 32 million terminal passengers in 2023, imposed by planning authorities. The airport operator DAA publicly warned that the cap risked diverting connectivity and associated employment to uncapped rival hub airports elsewhere in Europe — Amsterdam, Frankfurt, Paris — that face no equivalent restriction. That constraint sits alongside a Ryanair operation that carried six times Dublin's permitted terminal throughput, none of which was bounded by any Irish planning decision. The 39.2 million CSO figure slightly exceeds the 32 million cap because the cap applies to terminal passengers specifically, not all airport movements, but the underlying tension between Ireland's regulated physical infrastructure and its airlines' European-scale operations is real.
The 2023 Global Recovery and China's Role
Global air travel in 2023 reached 94.1% of pre-pandemic 2019 levels according to IATA, with total traffic up 36.9% versus 2022. By the fourth quarter of 2023, global traffic had recovered to 98.2% of the equivalent 2019 quarter, suggesting the remaining gap was closing rapidly. The single largest driver of that recovery was China's exit from its zero-COVID policy, which had suppressed a domestic aviation market that contributes over 25% of global domestic revenue passenger kilometres. Asia-Pacific airlines more than doubled their RPKs in 2023, rising 126.1% versus 2022 — yet despite that surge, the region remained 27.3% below pre-pandemic levels by year-end, reflecting how severe the zero-COVID suppression had been. China's 619.2 million passengers place it second globally, but that figure is almost entirely domestic: international routes from China remained well below 2019 levels in 2023, even as domestic demand rebounded sharply after restrictions lifted. The 94.1% headline recovery also masks a structural lag in long-haul and corporate travel — GDS agency bookings, a standard proxy for business travel, still trailed pre-pandemic levels by around 30%, and global RPKs for 2023 remained roughly 5% below 2019 on the full-year count.
North America Dominates; Africa Barely Registers
The United States recorded 941.6 million passengers in 2023, accounting for 22.1% of global traffic — nearly matching all of Europe's combined 22.4% share of 956.8 million across dozens of countries. North American carriers had already surpassed their 2019 international traffic record by 1.4% by year-end, the strongest recovery performance of any major region. The US has held the top position for decades, the product of a deregulated domestic aviation market since 1978, a vast continental landmass, and a hub-and-spoke network operating at industrial scale. At the opposite end of the distribution, all of Africa generated 95.3 million passengers in 2023 — 2.2% of global traffic — roughly equal to Brazil alone (95.4 million, rank 10). That African aggregate figure masks significant internal variation: Ethiopian Airlines, Africa's largest carrier, recorded $6.1 billion in earnings in fiscal year 2022/23 and transported 13.7 million passengers that year, placing Ethiopia at rank 43 globally with 15.3 million passengers. North Africa and East Africa recovered strongly in 2023 while Southern Africa lagged, with South African Airways still undergoing restructuring. RwandAir recorded 82% revenue growth in 2023 — rising from $253 million to approximately $461 million — supported by a 49% Qatar Airways stake and Qatar's 60% stake in Rwanda's new $2 billion Bugesera International Airport. Africa's passenger volumes are not projected to reach 345 million annually until 2043.
The Geography of Ocean Distance and Hub Dominance
Australia (69.0 million passengers, rank 17) accounts for 1.62% of global air passengers despite being one of the world's most geographically isolated major economies. The entire Oceania and Pacific region tallies just 88.4 million passengers — 2.1% of global traffic — a reflection of how vast ocean distances make air travel structurally necessary but constrain volumes relative to densely connected continental markets. Gulf hub carriers operate on the opposite logic: Emirates, Etihad, and Qatar Airways have transformed small national populations into globally dominant transit points by positioning their hubs on the most efficient long-haul routing between Europe, Asia, and Africa.
As aviation returns toward pre-pandemic capacity, the structural questions for the next five years are whether Africa's projected growth materialises on schedule, whether China's international routes recover to 2019 levels, and whether the Gulf hub model sustains its share as rival airports expand. The underlying ranking will continue to reflect where airlines are registered as much as where passengers actually travel.
One chart like this in your inbox each week, explained in plain English — join the Everything Econ newsletter. Always free, and you can unsubscribe any time.
Take this one home
Get this visualisation as a download, wallpaper, or printed poster.
← Back to all visualisations & articles
Follow Everything Econ: YouTube · TikTok · X · Instagram · Facebook