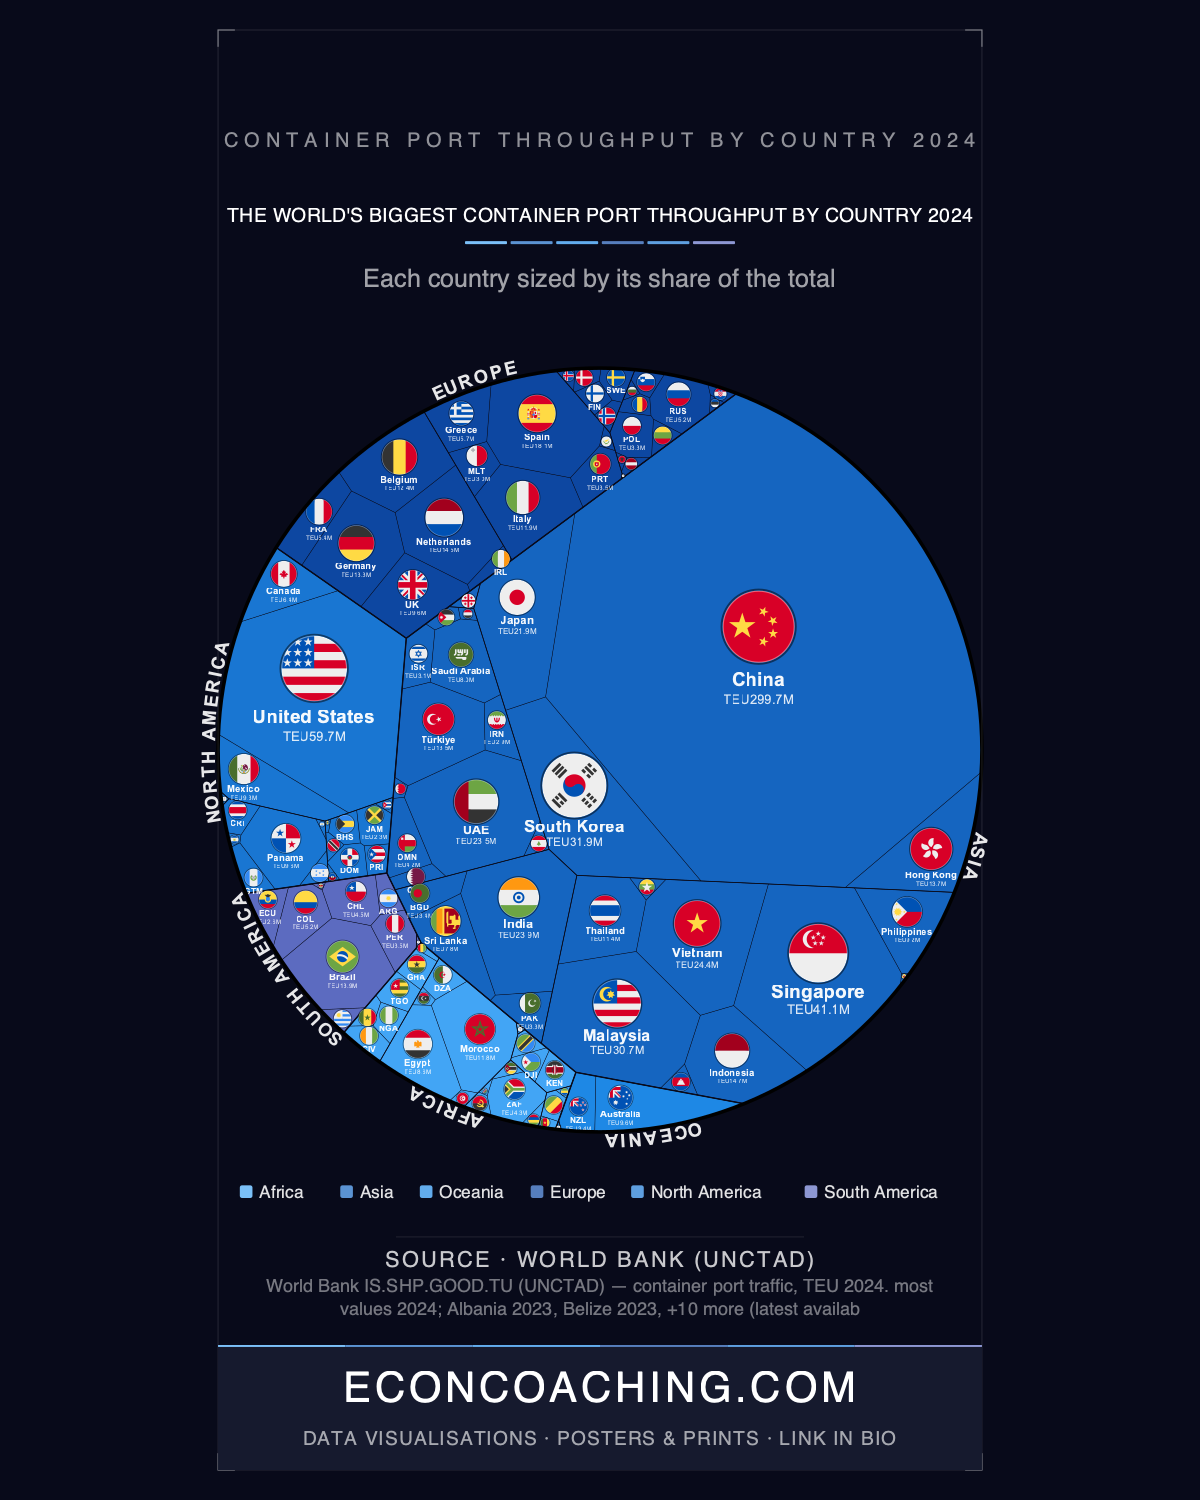
The treemap accompanying this article makes the central fact of global container shipping impossible to ignore: China's rectangle occupies roughly a third of the entire chart, and the gap between it and the United States is itself larger than the entire European continent's combined throughput. China moved 299.7 million TEU through its ports in 2024, against 59.7 million for the United States and 117.7 million for all of Europe. One country, one third of all global container volume, across a system that handled 903.7 million TEU in total.
Shanghai's Record and What It Reveals About Chinese Port Concentration
Shanghai International Port Group oversaw 51.5 million TEU in 2024, making Shanghai the first port in history to surpass 50 million TEU in a single year and its 15th consecutive year as the world's busiest container port. Ningbo-Zhoushan, ranked separately, achieved 39.3 million TEU, an 11% rise and its fastest growth in seven years, while retaining the title of world's largest port by total cargo tonnage for the 16th consecutive year at 1.37 billion metric tons. China holds 7 of the world's top 10 container ports. The country's single-year absolute increase of 20.94 million TEU exceeded the entire annual throughput of Spain, the tenth-ranked country at 18.1 million TEU.
One structural qualification matters here: China's 33.16% share does not translate directly into an equivalent share of Chinese export origin. A meaningful portion of throughput at ports like Shenzhen and Ningbo involves transshipment of goods manufactured elsewhere in Asia, passing through Chinese terminals en route to their final destinations. The dominance is real; its interpretation as purely Chinese export volume is not.
The Geometry of Asian Dominance
Asia as a whole accounted for 66.2% of global container port throughput in 2024, handling 598.6 million of the 903.7 million total TEU. Europe ranked second at 13.0% (117.7 million TEU) and North America third at 10.9% (98.6 million TEU). Singapore, a city-state of approximately 6 million people, processed 41.1 million TEU, roughly equal to all of South America's 32.4 million TEU combined across an entire continent. South Korea (31.9 million TEU, ranked fourth) and Malaysia (30.7 million TEU, fifth) together contributed more than 60 million TEU, placing two relatively small Asian economies well ahead of Japan (21.9 million TEU, ninth) and the United Arab Emirates (23.5 million TEU, eighth).
The United States, at 59.7 million TEU and ranked second globally, handles that volume across dozens of dispersed ports rather than through any single dominant hub, a structural characteristic that makes its logistics network comparatively less concentrated per port than those of Singapore, China, or the UAE.
Vietnam, India, and the Supply-Chain Diversification Story
Vietnam's container throughput grew by 3.35 million TEU in 2024, the third-largest absolute national gain globally, bringing the country to 24.4 million TEU and sixth place in the world rankings. In 2008, Vietnam handled only 4.4 million TEU; its 2024 volume is approximately 5.6 times that level, a transformation driven by its emergence as a manufacturing hub for electronics, textiles, and footwear as companies diversified supply chains. The country's 2024 throughput of 24.4 million TEU exceeded that of Japan (21.9 million), an economy with considerably deeper industrial history.
India's trajectory is more recent but directionally consistent. The Jawaharlal Nehru Port Authority crossed 7 million TEU for the first time in its 25-year history in 2024, recording 7.05 million TEU, an 11% year-on-year increase. India's total national throughput reached 23.9 million TEU, placing it seventh globally. Adani Ports and Special Economic Zone (APSEZ) is the dominant private operator across Indian terminals, and its scale has grown alongside broader port capacity investment. India's ranking of seventh, between Vietnam and the UAE, reflects both genuine throughput growth and the ceiling imposed by infrastructure that remains under expansion across multiple major ports.
Tanger Med and the Limits of Crisis-Driven Growth
Morocco's Tanger Med port recorded 10.24 million TEU in 2024, growth of 18.8% year-on-year, entering the global top 20 for the first time and ranking 17th worldwide. It is the only African or Mediterranean port in that group. Its 2024 volume exceeded its own nominal design capacity of 9 million TEU, and since 2015 it has grown by 245%, more than tripling over the decade and reaching its originally projected 2027 milestone three years ahead of schedule.
The growth carries a significant qualification. According to Global Maritime Hub estimates, roughly a quarter of Tanger Med's 2024 surge was attributable to Red Sea disruption rerouting: Houthi attacks diverted approximately 80% of Suez Canal container capacity at peak, pushing vessels onto longer Cape of Good Hope routes and increasing transshipment demand at Mediterranean and west African hubs. If security in the Suez corridor normalises, Tanger Med's throughput may moderate. The same dynamic partially explains Singapore's strong 41.1 million TEU and Malaysia's 30.7 million TEU, both of which benefited from rerouted transshipment flows.
Africa's broader container geography tells a different story. Morocco's 2024 volume of approximately 11.8 million TEU at the national level places it 19th globally, but the remaining 54 African nations collectively handled only around 31.7 million TEU, less than Malaysia alone. Five West African nations (Togo, Côte d'Ivoire, Ghana, Nigeria, and Senegal) combined for roughly 8.0 million TEU, less than Australia's 9.58 million TEU at 22nd globally. Port infrastructure underdevelopment across Sub-Saharan and East Africa remains severe by any comparative measure.
Where the System Heads From Here
The UNCTAD Review of Maritime Transport 2024 noted that the dual disruption of Red Sea attacks and Panama Canal drought restrictions increased global container ship demand by 12% in 2024 as vessels were rerouted onto longer passages. Against that backdrop, China still added 20.94 million TEU in a single year, and Shanghai broke the 50 million TEU barrier for the first time in history. Global container port throughput reached 903.7 million TEU in 2024, up roughly 68.7% from 2010 levels. The structural long-run trend is Asian concentration compounding; the short-run variable is whether chokepoint disruptions persist, which would continue to inflate transshipment hubs disproportionately and obscure underlying demand signals. Vietnam's manufacturing ascent and India's port investment trajectory suggest the gap between China and the next tier will eventually narrow, but at 2024 growth rates, that gap is still widening in absolute TEU terms.
For more data-driven analysis of global economics and the trends reshaping the world economy, visit econcoaching.com.
Take this one home
Get this visualisation as a download, wallpaper, or printed poster.
← Back to all visualisations & articles
Follow Everything Econ: YouTube · TikTok · X · Instagram · Facebook