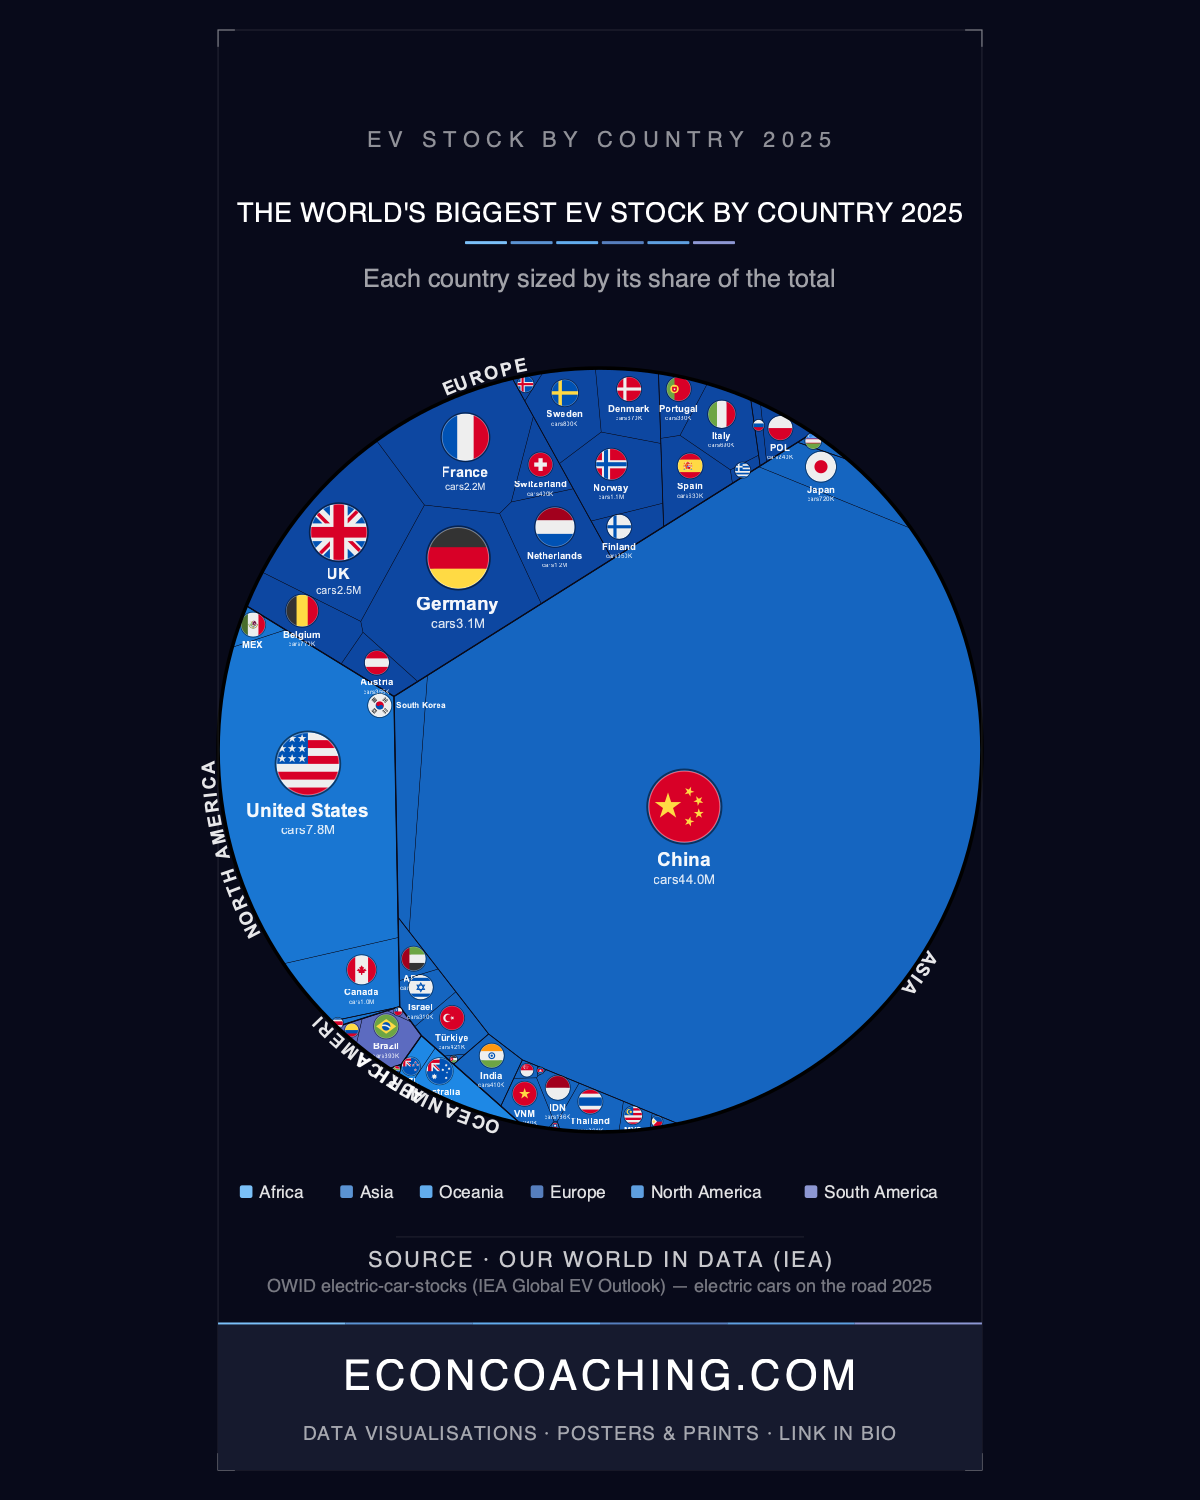
The treemap accompanying this article makes one fact impossible to ignore before you read a single label: one cell occupies roughly three-fifths of the entire chart. That cell is China, which held 44 million electric vehicles on its roads at the end of 2025, equal to 59.83% of the entire global EV stock. The United States, at 7.8 million units, is the second-largest country on the chart and takes up roughly half the space that China's block leaves unclaimed. Every other country in the world fits into what remains.
China's Dominance, and Its Limits
Six out of every ten electric cars sold globally in 2025 were sold in China, and in 11 of 12 months that year, EVs exceeded 50% of monthly new car sales there. China's EV penetration jumped from 6.3% of new car sales in 2020 to approximately 55% in 2025. BYD, which sold roughly 4.3 million vehicles globally in 2024 against Tesla's approximately 1.8 million, is the single largest driver of that volume, having definitively overtaken Tesla as the world's largest EV seller.
The concentration is real, but it requires one qualification: EVs still represent only about 13% of China's total car fleet, meaning 87% of Chinese vehicles on the road remain combustion-powered. China's near-60% share of global EV stock is partly a function of having the world's largest car fleet in absolute terms. The transition in China is deep and accelerating, but it is not finished, and the gap between new-car sales share and on-road fleet share illustrates how much inertia exists in any large vehicle stock.
Norway's Near-Total Electrification
Norway recorded 95.9% of all new car registrations as electric in 2025, up from 88.9% in 2024, with December alone reaching 98%. In 2018, Norway's EV new-car share was 31.2%, then considered extraordinary. The 2025 figure represents a complete transformation of the new-car market within seven years. A record 179,550 new cars were registered in 2025, a 40% year-on-year increase, and Tesla held 19.1% of that market despite the availability of dozens of competing models.
Norway's 1.06 million EVs place it seventh globally in stock, despite a population of 5.5 million, which no country at similar scale comes close to matching on a per-capita basis. The policy mechanism matters here: Norway achieved this primarily through heavy taxation of combustion vehicles rather than direct EV subsidies, which makes the model financially and politically difficult to replicate in lower-income countries or in markets where governments are less willing to impose that level of fiscal pressure on conventional cars.
The Legacy Fleet Problem
Only around 5% of vehicles worldwide are currently electric, even though one in four new cars sold globally in 2025 was electric. That gap is the central arithmetic of the transition: new-car sales share and on-road fleet share diverge sharply because the existing stock of combustion vehicles runs into the hundreds of millions and turns over slowly. The IEA projects EV new-car sales reaching 50% globally by 2035 even without additional policy measures, but at current fleet replacement rates, a predominantly electric global vehicle stock remains decades away. Government subsidies as a share of total EV spending fell from over 12% in 2019 to under 7% in 2025, which reflects declining battery costs and growing consumer demand rather than policy withdrawal, but the transition is still a long-run infrastructure and fleet story, not a near-term one.
India and Brazil: Scale Without Stock
India's EV sales grew 46-fold between 2016 and 2025, from roughly 50,000 units to 2.3 million, a growth rate that outpaces the global average of approximately 20-fold over the same period. Despite that trajectory, India ranks only 18th globally in EV stock with 410,000 units. The explanation is compositional: nearly 87% of India's EV volumes are two-wheelers and three-wheelers, not passenger cars. The on-road passenger car EV stock remains a small fraction of total sales, which is why the stock ranking underestimates India's actual adoption momentum while also limiting its direct comparability to car-dominated markets.
Latin America saw 75% growth in EV sales in 2025, led by Brazil and Mexico. Brazil holds 390,000 units of EV stock and in October 2025 became the site of BYD's first manufacturing facility in South America, opened in Camaçari. That plant signals a structural bet on the region rather than a marginal export play. Mexico, not yet reflected in the top-18 stock rankings, is the other primary growth market in the region.
Africa's Near-Absence
All of Africa appears in the global EV stock data through a single country: South Africa, with 9,200 units, equal to 0.01% of global stock. Battery EV sales in South Africa actually fell 17% in 2025, from 1,231 to 1,018 units, even as the broader South African automotive market grew 15.7%. BEVs represented just 0.17% of vehicle sales in the country. The contrast between South Africa's cell on the treemap, which is barely visible, and China's cell, which dominates three-fifths of the chart, is the starkest illustration of how unevenly the global EV transition is distributed across continents. Infrastructure gaps, electricity reliability, and purchasing power constraints are all structural factors in Africa's near-zero share, and none of them resolves quickly.
The IEA's Global EV Outlook 2026 confirms 2025 as the year global EV new-car sales crossed the 25% threshold, a landmark milestone that coexists with a global on-road fleet that is still 95% combustion-powered. The countries that reach a high EV stock share first will have durable advantages in battery technology, grid integration experience, and domestic manufacturing capacity. The gap between China and every other country in that race, visible at a glance in the treemap, is already large enough to be structurally consequential.
For more data-driven analysis of global economics and the trends reshaping the world economy, visit econcoaching.com.
Take this one home
Get this visualisation as a download, wallpaper, or printed poster.
← Back to all visualisations & articles
Follow Everything Econ: YouTube · TikTok · X · Instagram · Facebook