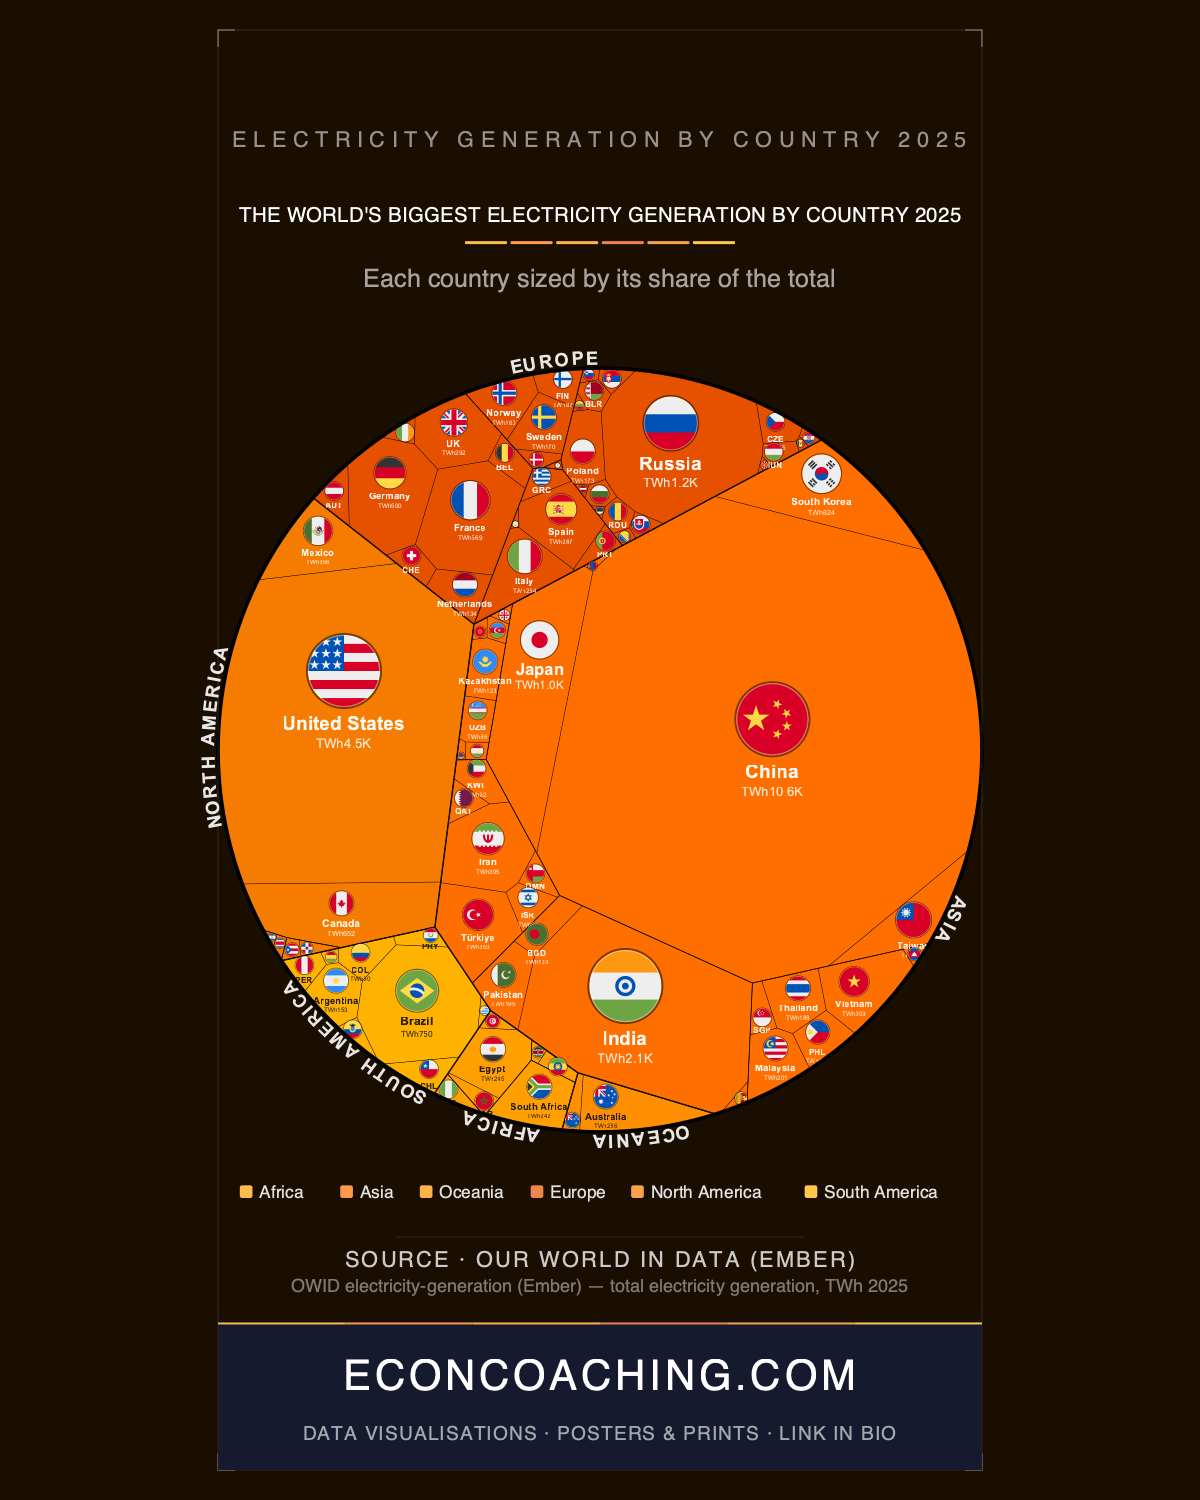
China generated 10,583 TWh of electricity in 2025, accounting for 35.75% of all electricity produced on Earth. Add up the United States (4,520 TWh), India (2,082 TWh), Russia (1,193 TWh), and Japan (1,030 TWh), and the total still falls short of China alone. The treemap accompanying this article makes that disproportion immediate: China's rectangle consumes more than a third of the entire chart, while countries that consider themselves major industrial powers are reduced to slivers beside it.
The Scale of One Country's Dominance
China became the first country ever to surpass 10 trillion kWh in annual electricity generation in 2025, a milestone with no historical precedent. Its total output exceeded the combined consumption of the European Union, Russia, India, and Japan. As recently as 2000, the United States was the world's largest electricity generator; China overtook it around 2011 and now generates roughly 2.35 times as much. The US, at 4,520 TWh, remains a substantial second, but the gap has moved well beyond anything that incremental growth can close.
The scale also changes what China's energy decisions mean for everyone else. In 2024, China accounted for more than 60% of global renewable energy capacity additions and installed more new solar capacity in that single year than the rest of the world combined, according to Ember's Global Electricity Review 2025. China's National Energy Administration reported that China surpassed its own 2030 wind and solar capacity target of 1.2 TW five years ahead of schedule, having installed 277 GW of solar and 80 GW of wind in 2024 alone. When one country represents that share of global capacity additions, its policy choices set the trajectory for global clean energy deployment regardless of what other governments do.
China's Coal Inflection and Its Limits
In 2025, China recorded its first absolute decline in coal generation since 2015, with coal output falling by 71 TWh as solar generation surged 40% year-on-year to 336 TWh. Renewables met all of China's new demand growth in 2025, meaning the increase in total generation came entirely from clean sources. That is a structural shift worth distinguishing from a cyclical dip. Globally, renewables surpassed coal to provide more than one-third of total electricity generation in 2025, the first time that milestone has been reached.
One qualification applies. China's aggregate generation total does not translate evenly into per-capita energy access. The country's enormous national figure coexists with significant regional variation in consumption. The per-capita framing matters more when examining countries further down the rankings: India, ranked third at 2,082 TWh, has a per-capita consumption of approximately 1,355 kWh per person, well below the global average of 3,736 kWh, which means that India's third-place national ranking obscures the extent to which its citizens remain underserved relative to the global norm. High national totals and adequate per-capita access are entirely separate measurements.
The Countries Rising Through the Ranks
India's 2,082 TWh places it third globally, ahead of Russia and Japan, and in 2024 India overtook Germany to become the world's third-largest generator of wind and solar electricity. Wind and solar now supply 10% of India's electricity, a share that was negligible a decade ago.
Vietnam, ranked 14th at 310 TWh, was not in the global top 20 as recently as the early 2010s. Its generation has grown alongside export-oriented manufacturing, placing it ahead of long-established industrial economies including the United Kingdom and Taiwan. Brazil, ranked sixth at 751 TWh, generated 88% of its electricity from renewables in 2024 through a power sector that relies on fossil fuels for just 11% of supply, having already exceeded its 2030 national renewable electricity target of 84%. Brazil's power sector emissions peaked in 2014 and had fallen 31% by 2024, even as electricity demand rose 22% over the same period, according to Empresa de Pesquisa Energetica. That combination, growing demand and falling emissions, is rare among large economies.
The comparison between Brazil and Germany illustrates why volume and cleanliness are separate axes in electricity generation. Germany ranks 10th at 500 TWh, less than Brazil's 751 TWh, and still relies on coal despite significant renewables expansion. Generating less electricity does not mean generating cleaner electricity.
Africa's Generation Gap
Africa generated 644 TWh in 2025, representing 2.2% of the world total across a continent of roughly 1.4 billion people. Egypt, ranked 20th at 246 TWh, is the only African country in the global top 20; South Africa, just outside at 21st with 243 TWh, comes close but the two together account for the vast majority of the continent's representation near the top of the rankings. Roughly 600 million Africans, close to two in every five people on the continent, have no access to electricity at all.
Africa's electricity demand grew 5.2% in 2025, above the global average of 2.8%, making it the fastest-growing demand region in the world. The IEA projects that Africa's demand will continue to grow at 4-5% annually, yet the continent's share of world generation has remained at 2.2%, suggesting the gap between demand and supply will widen unless investment accelerates substantially. The Grand Ethiopian Renaissance Dam has added meaningful capacity in East Africa, but supply constraints, particularly across sub-Saharan Africa, continue to suppress actual consumption below what demand growth would otherwise produce. Russia, by contrast, saw its generation contract by approximately 2% in 2025, one of the few top-10 nations where output declined, illustrating that a high historical rank carries no guarantee of continued growth under economic and geopolitical pressure.
Australia, ranked 18th at 286 TWh, represents the entire Oceania region in the top 20; together with New Zealand's 43 TWh, the region accounts for just 1.1% of world generation.
The 2025 electricity rankings capture a system in a genuine transition. China's coal inflection, renewables globally overtaking coal for the first time, and Africa's expanding generation gap are all moving simultaneously, and the direction each takes over the next decade will determine whether the treemap's distortions narrow or compound further.
For more data-driven analysis of global economics and the trends reshaping the world economy, visit econcoaching.com.
Take this one home
Get this visualisation as a download, wallpaper, or printed poster.
← Back to all visualisations & articles
Follow Everything Econ: YouTube · TikTok · X · Instagram · Facebook