
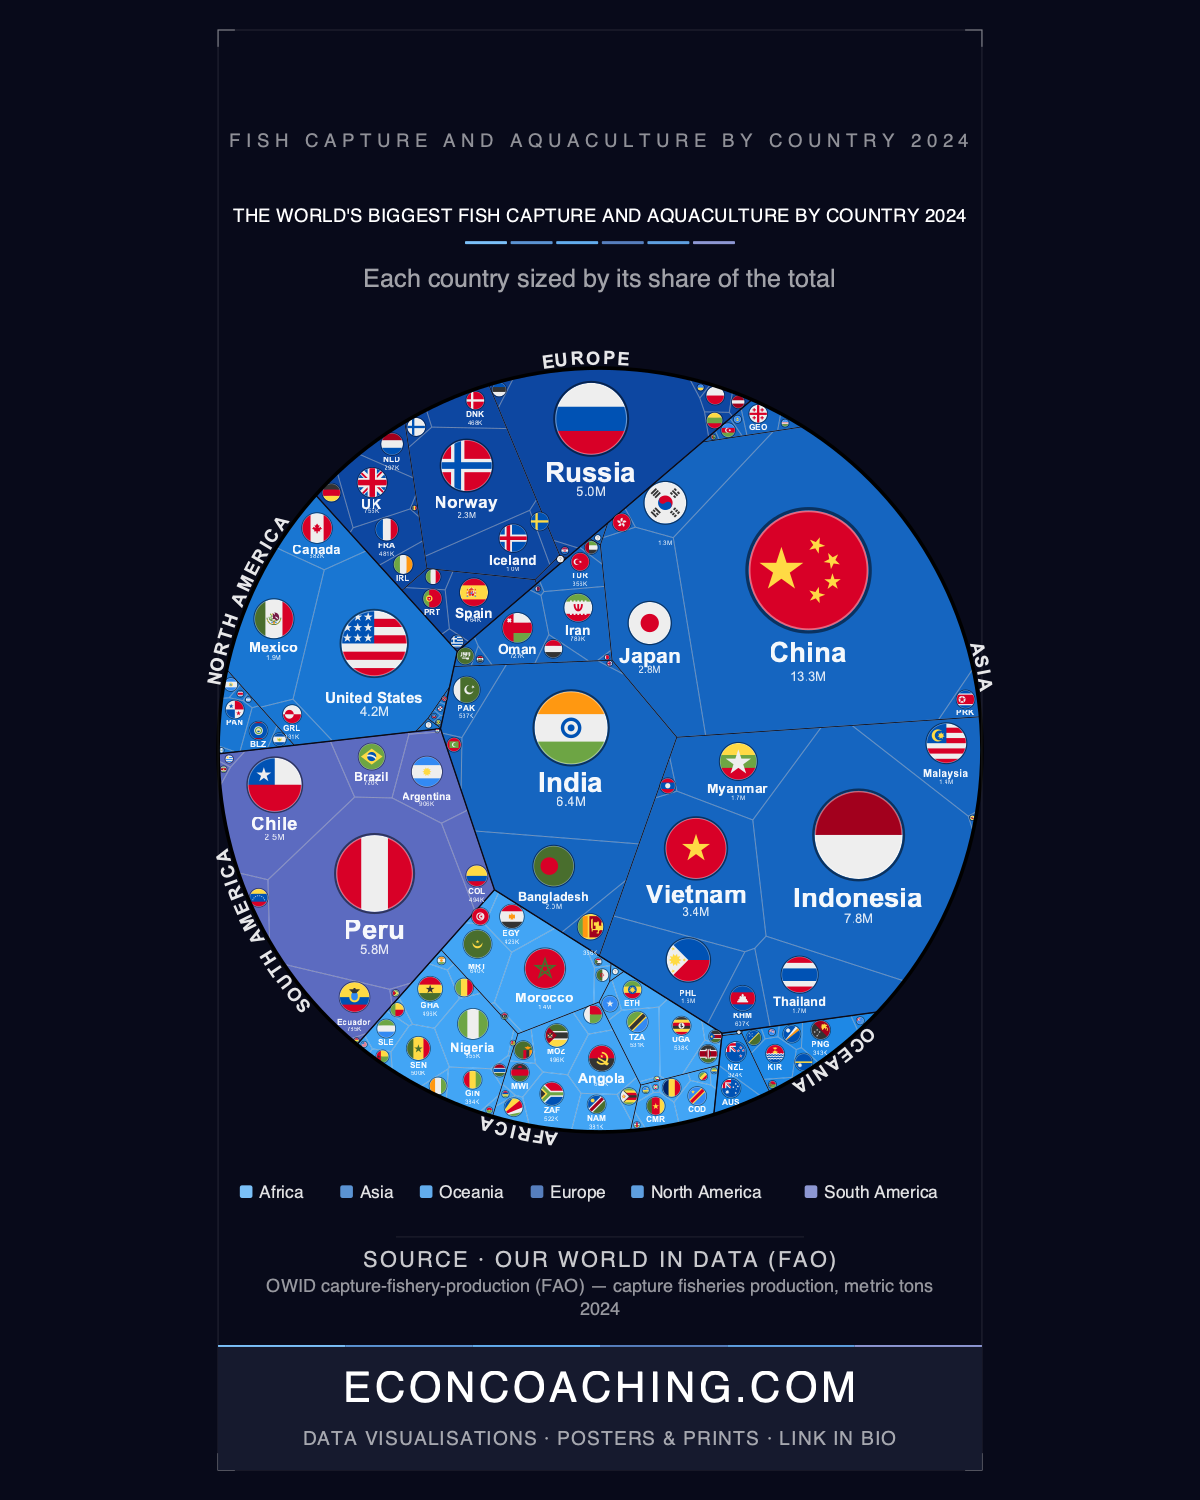
Peru and Chile together produced about 8.29 million tonnes of fish in 2024, more than the United States, Canada and Mexico combined, whose total reaches 7.91 million tonnes. Two South American countries, on a treemap sized by output rather than land area, occupy more space than an entire continent covering 21 countries. The distortion is the point: a chart built this way strips away geography and replaces it with production, and the resulting picture of who actually feeds the world's fish supply looks nothing like a standard map.
Peru, Chile and a Fishery Still Recovering From 1972
Peru alone produced 5.76 million tonnes in 2024, ranking fourth globally at 6.22% of world output, with Chile adding 2.53 million tonnes for ninth place at 2.73%. Most of Peru's volume traces back to a single stock: the anchoveta, which supplies roughly a fifth of the world's fishmeal and fish oil. This is the same fishery that peaked at over 12 million tonnes a year in the late 1960s, making it the largest single fishery in recorded history, before the 1972 El Niño collapsed it and reshaped global fishmeal markets. That volatility has not gone away. A 2023 El Niño forced Peru's Ministry of Production, PRODUCE, to cancel the main anchovy season, cutting the national catch 52% year-over-year and costing more than $1.4 billion in lost export sales. By 2026, a further El Niño had pushed Peru's anchovy quota to a decade low, sending global fishmeal prices to around $2,500 per tonne, roughly 25% above the 2023 shortage level. A country producing more fish than North America's three largest economies combined is, at the same time, one bad ocean-temperature cycle away from a global feed-price shock.
Asia's Majority and the Uncertainty Behind China's Number
Asia accounts for 51.9% of everything captured and farmed on Earth, more than every other continent combined. China alone contributes 13.26 million tonnes, 14.3% of the world total, exceeding the combined output of every country in Europe at 12.71 million tonnes. China's dominance is relatively recent: Japan led global fishing for most of the twentieth century until China's aquaculture-driven output overtook it around the 1990s, a shift built on state-backed aquaculture expansion that began with the country's 1980s economic reforms. That number deserves a caveat. FAO and independent researchers have long flagged China's official capture-fisheries statistics as likely overstated, which means any comparison built on China's total, including the one above against all of Europe, carries more uncertainty than the ranking suggests at face value.
South America Edges Out Africa, With a Dozen Countries to Africa's 54
South America produces slightly more fish than the whole of Africa, 12.5% of the global total against 11.7%. What makes that comparison notable is the count of countries behind each figure: roughly a dozen nations in South America against 54 in Africa. Norway sharpens the same pattern from a different angle. With a population of just 5.5 million, Norway is the world's tenth-largest producer at 2.3 million tonnes, 2.51% of the total, and Europe's single biggest, outproducing East Africa's five largest fishing nations (Uganda, Tanzania, Ethiopia, Kenya and Somalia) combined. Volume tells only part of the story here, since Norway's output leans heavily on farmed salmon, a high-value product that can generate more export revenue per tonne than far larger volumes of low-value catch such as reduction-grade anchovy or carp.
Farmed Fish Overtook Wild Catch in 2022
Behind every country-level figure sits a structural change confirmed in FAO's State of World Fisheries and Aquaculture 2024 report: aquaculture overtook capture fisheries globally for the first time in 2022, after wild catches plateaued for three decades. This dataset's global total of roughly 92.7 million tonnes tracks closely with wild-capture volumes specifically, and it is worth noting that broader FAO accounting covering all aquatic animals and plants put combined 2022 fisheries-and-aquaculture production above 223 million tonnes, so the country rankings here are one lens on the industry rather than the complete picture. The growth has not come without cost to the resource base. About 37.7% of the world's monitored fish stocks are now classified as overfished, up from roughly 35% just two years earlier, a trend running in parallel with, not despite, record global production.
Who the Catch Actually Belongs To
National totals can mask who is doing the fishing. China's distant-water fleet, the largest in the world, has been linked by Greenpeace and other observers to the loss of over 300,000 artisanal fishing jobs in West Africa, with more than 400 Chinese vessels reported operating off the West African coast in recent years. In Argentina, Chinese companies control at least 62 industrial fishing vessels flying the Argentine flag, including most of the country's squid fleet, meaning Argentina's official catch total partly reflects foreign-financed activity rather than domestically owned fishing. Kiribati illustrates the reverse arrangement: a Pacific nation of roughly 133,000 people ranks 51st globally, an output achieved largely because foreign tuna purse-seine fleets pay to license access to its exclusive economic zone rather than through a domestic fishing industry of comparable size.
Peru's decade-low anchovy quota in 2026 and the 37.7% overfished-stock figure point to the same underlying tension: global production keeps setting records while the resource base narrows and the feed supply chain concentrates around a handful of volatile fisheries. How that tension resolves, through aquaculture substitution, stock recovery, or repeated price shocks like fishmeal's 2026 spike, will shape food and feed costs well beyond the countries named on this ranking.
For more data-driven analysis of global economics and the trends reshaping the world economy, visit econcoaching.com.
Take one home
Every country drawn to scale, as an instant printable download or a museum-quality matte poster printed to order.
← Back to all visualisations & articles
Follow Everything Econ: YouTube · TikTok · X · Instagram · Facebook
Keep exploring
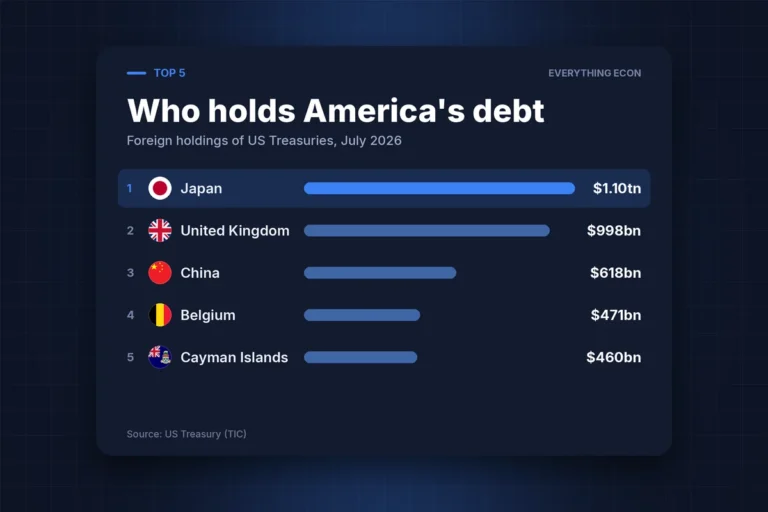 Economy · GraphicWho Holds America’s Debt? The $9.25tn Owned Abroad407K views3 min read
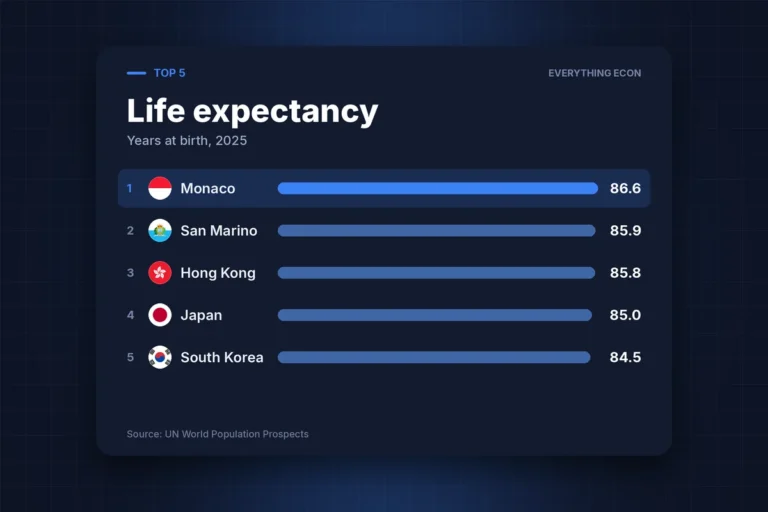 Economy · RankingThe Countries Where an Extra Three Decades of Life Comes as Standard293K views3 min read
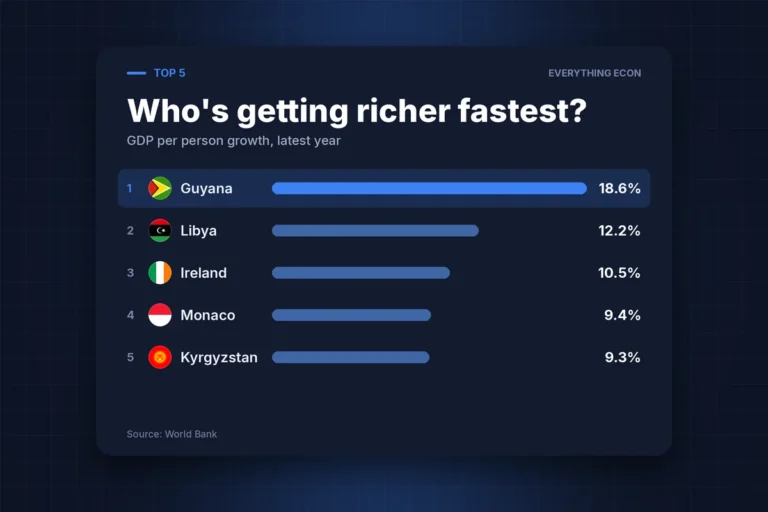 Economy · RankingThe Countries Where Money Is Growing Fastest — and Where It’s Vanishing279K views3 min read