Every year, countries make a choice: spend what they have today, or invest it in something that will pay off tomorrow. Gross fixed capital formation — in plain terms, the share of a country's total output that goes into buildings, machinery, roads, and infrastructure — tells us how seriously a nation is backing its own future. The World Bank tracks this figure for countries around the world, and the gaps it reveals are striking.
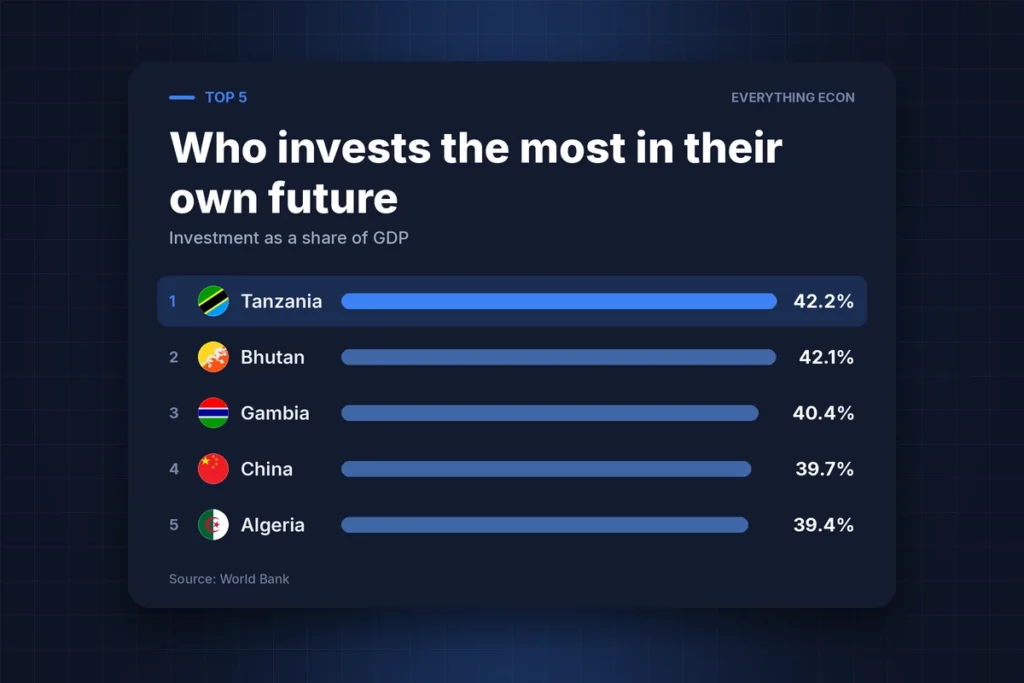
At a glance · Top 5
Investment as a share of GDP
- 1Tanzania42.2%
- 2Bhutan42.1%
- 3Gambia40.4%
- 4China39.7%
- 5Algeria39.4%
Source: World Bank
The Surprising Leaders
You might expect wealthy industrial giants to top this list. Instead, the countries investing the largest shares of their economies are a varied group spanning Africa, Asia, and the Pacific.
Bhutan sits at number two with 42.1% of GDP invested, powered by enormous state-led hydropower and infrastructure projects, most of them funded with support from India. That figure is actually a step down from its recent peak of 44.6% in 2023, suggesting even Bhutan's extraordinary building pace is beginning to ease.
China ranks fourth at 39.7%, and its story is one of deliberate, decades-long policy. In 1990, China invested just 24% of GDP. By 2021, that figure had climbed to around 42%, driven by state infrastructure programmes launched during the reforms of the 1980s and later extended worldwide through the Belt and Road Initiative. To put that commitment in context, China's fellow BRIC economies — India, Russia, and Brazil — each invested only between 19% and 29% of GDP in 2021. India, which appears at number thirteen on this list at 31.7%, is the only one that comes close.
Rwanda offers perhaps the most remarkable context of all. At 32.2% of GDP invested, it ranks twelfth globally, supported by a national plan called Vision 2050, which sets targets of middle-income status by 2035 and high-income status by 2050. Since 1994, Rwanda's economy has grown roughly nineteen-fold — from around $752 million to $14.1 billion in 2023 — and sustained investment has been central to that transformation.
What Drags Countries to the Bottom?
The bottom of the ranking is defined not by poverty, but by instability and collapse. Sudan registers just 0.7% of GDP in investment — barely a rounding error. Lebanon stands at 1.4%, Syria at 4.4%, and Venezuela at 4.6%. These are not simply poor countries; they are countries where conflict, economic crisis, or political dysfunction has made long-term investment nearly impossible. When businesses and governments cannot plan for next year, they certainly cannot build for the next decade.
Equatorial Guinea, despite holding significant oil wealth, sits at 6.4% — a reminder that natural resource income does not automatically translate into productive investment.
And the Number One?
Tanzania tops the entire ranking at 42.2% of GDP. Low-income countries with strong growth prospects tend to attract the highest returns on investment, which pulls in both domestic savings and foreign capital. Tanzania's position reflects exactly that dynamic: a fast-growing economy offering returns that richer, more mature economies simply cannot match.
It is also worth noting where the world's largest economies sit. The United States invests 21.6% of GDP — roughly half of China's rate — placing it squarely in the middle of the global pack. Germany, at 20.5%, falls below even the EU average of 21.2%, while its Eastern European neighbours Czech Republic (26.5%) and Romania (25.3%) invest considerably more.
A country's investment rate will not tell you everything, but it tells you something important: how urgently a nation believes it needs to build.
Data: World Bank, Gross Fixed Capital Formation (% of GDP).
Get a new data story like this every week — join the newsletter.
Browse every visualisation on the visualisations page.
Take one home
Every country drawn to scale, as an instant printable download or a museum-quality matte poster printed to order.