
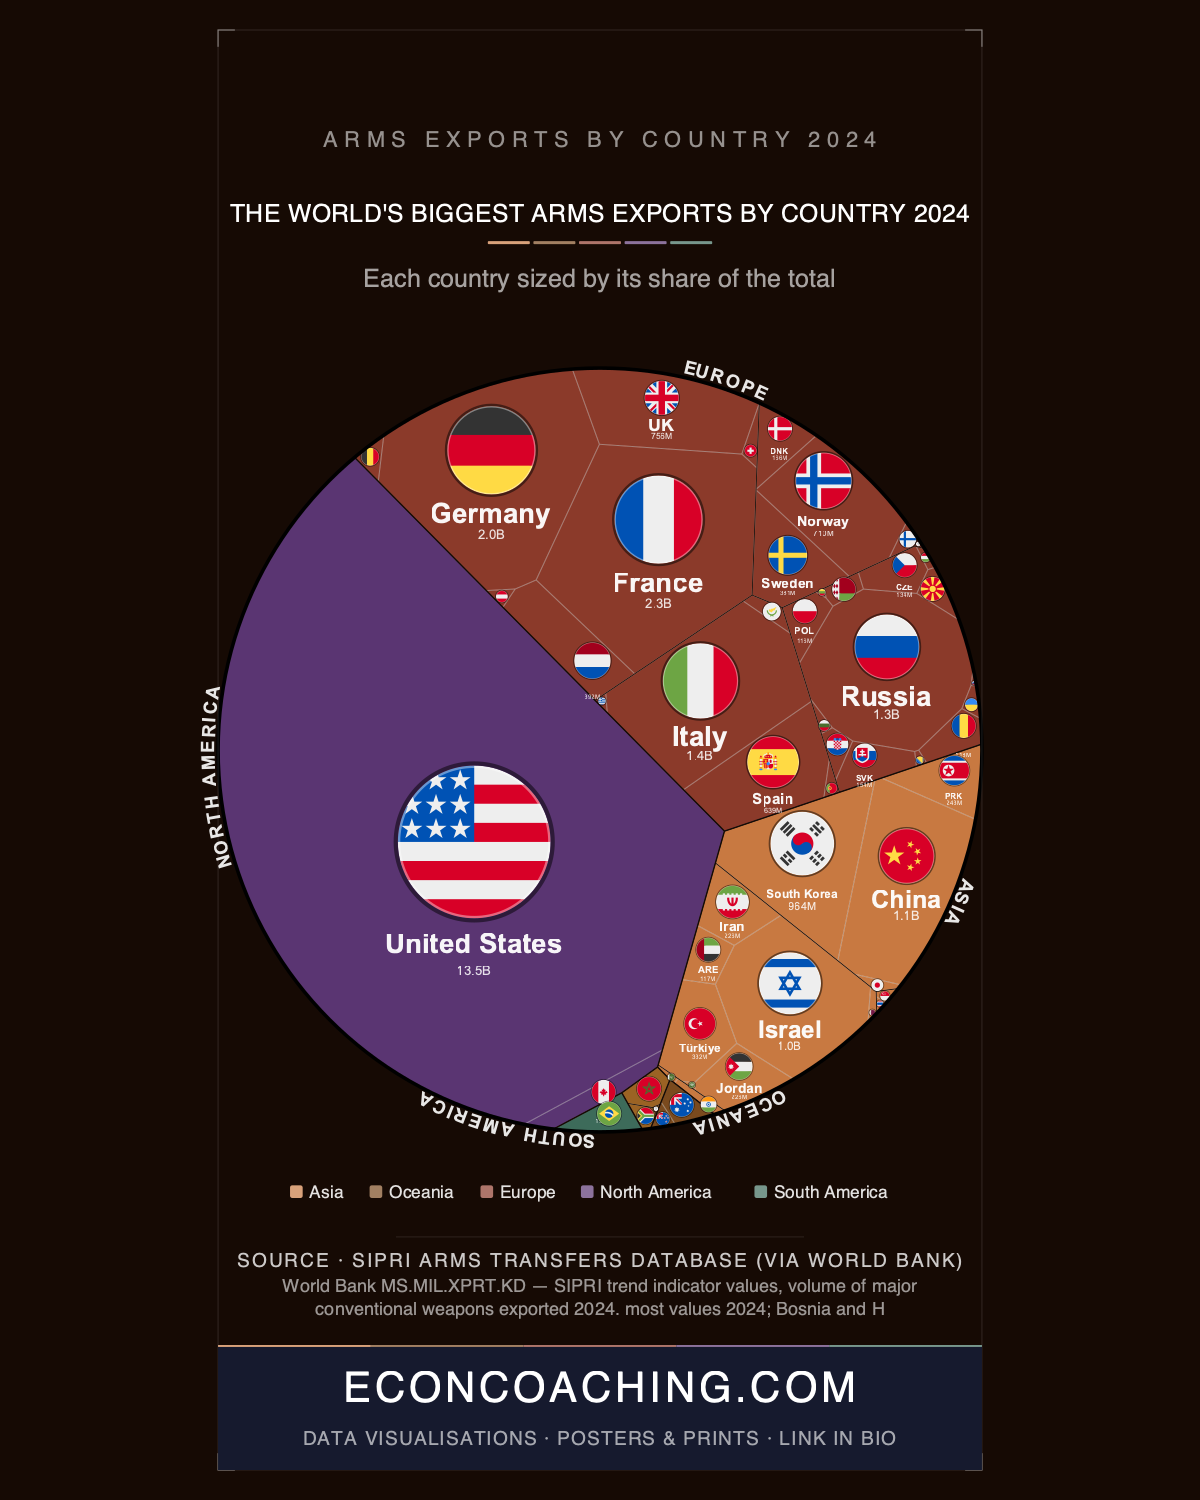
The United States alone accounts for 46.06% of global arms exports, more than the combined total of the next nine largest exporters on the list. On the treemap accompanying this article, where cell size reflects export value rather than geography, the United States forms a single block ($13.51 billion) larger than France, Germany, Italy, Russia, China, Israel, South Korea, the United Kingdom and Norway put together ($11.63 billion). No other category of global trade data produces a distortion this extreme from a single country.
One Country, Half the Market
The scale gap starts at the top and does not really continue: France, in second place, holds 7.75% of the global total ($2.27 billion), meaning the US share alone is roughly six times larger than the next-ranked exporter. These are SIPRI-style Trend Indicator Values, a standardised measure of the military capability embedded in transferred weapons rather than literal sale prices, so the dollar figures should be read as a proxy for hardware significance rather than actual revenue. It's also worth noting that SIPRI's most-cited public figures use five-year rolling averages, putting the US at 43% for 2020-24 or 42% for 2021-25; the single-year 2024 figure of 46.06% used here is higher than those averages and captures one year of an upward trend rather than the longer baseline. North America as a whole, essentially the US plus Canada, accounts for 46.6% of global arms exports, narrowly exceeding the entirety of Europe at 37.5%, a continent represented by more than 20 separate exporting countries in this dataset. A country's export volume is also a poor measure of how dependent its economy is on the arms trade: even $13.51 billion in US TIV sits as a small fraction of total US exports and GDP.
France Passes Russia for the First Time
France's rise to second place, at $2.27 billion, marks the first time in SIPRI's modern tracking history that France has outranked Russia in arms exports. Russia sits fifth at $1.34 billion (4.56%), a share that reflects a 64% decline in Russian arms exports between 2015-19 and 2020-24. During the Cold War the Soviet Union rivalled or exceeded the United States as the top global arms exporter; Russia's current position is a fraction of that former dominance. France's climb reflects decades of state investment in national champions including Dassault, Thales and Naval Group, and it lands alongside Germany (6.99%, $2.05 billion) and Italy (4.70%, $1.38 billion) in the top five, a cluster shaped by the wider European rearmament triggered by Russia's invasion of Ukraine. Ukraine became the world's single largest arms importer in the 2020-24 period, with imports increasing nearly 100-fold compared with 2015-19, a demand shock that fed directly into export growth for France, Germany and Italy.
South Korea's Fast Climb and a 2030 Target
South Korea ranks eighth globally at $964 million (3.29%), a notable position for a country that was a net arms importer for most of the Cold War and only began building an export-oriented defence industry in the 2000s and 2010s. Its K9 Thunder howitzer is now in service in nine countries following Poland's order in 2022, and Hanwha Aerospace has been central to that expansion. South Korean President Lee Jae-myung has set an explicit goal of moving the country from 10th place in 2024 to the world's 4th-largest arms exporter by 2030, which would mean overtaking Italy, Russia and China in six years. Whether that target is reachable depends on sustaining the kind of order volumes that already produced South Korea's jump within roughly a generation from importer to top-ten exporter.
Norway's Outsized Position and Africa's Absence
Norway ranks tenth at $710 million (2.42%), a striking position for a country of about 5.5 million people, and it sits ahead of larger economies elsewhere in the dataset. Kongsberg Gruppen's missile systems are the main driver of that share. At the other end of the scale, all of Africa's arms exports combined come to $102 million, 0.3% of the world total, which is less than Denmark's $166 million alone and roughly a third of what Israel exports on its own ($1.03 billion, 3.50%). South America is represented by a single exporter in this dataset, Brazil, at $116 million (0.4%), and Oceania appears only as the combined $95 million (0.3%) of Australia and New Zealand. A high rank on this list doesn't always signal a strong domestic arms industry: Jordan ties with Iran for 16th place globally at $226 million each (0.77%), a surprising position for a country better known as a major arms importer and US security partner, and one that likely reflects re-transfers rather than indigenous production.
North Korea's Embargoed Exports
North Korea ranks among the world's top 15 arms exporters despite operating under a UN arms embargo. It has reportedly supplied Russia with over 12 million artillery shells, ballistic missiles and self-propelled artillery systems since 2023, generating an estimated $20 billion in revenue, a scale of transfer that sits outside the formal export categories most other countries on this list operate within. Its presence in the top 15 alongside sanctioned and embargoed status underlines how the treemap captures capability transferred rather than the legality or formality of the trade route.
The world's 100 largest arms-producing companies generated a record $679 billion in revenue in 2024, the highest figure ever recorded, fuelled by the wars in Ukraine and Gaza, and SIPRI's 2025 update covering the following year is expected to show whether the US share keeps expanding, whether Russia's decline continues, and whether South Korea's climb toward its 2030 target has started to show up in the rankings. For more data-driven analysis of global economics and the trends reshaping the world economy, visit econcoaching.com.
Take one home
Every country drawn to scale, as an instant printable download or a museum-quality matte poster printed to order.
← Back to all visualisations & articles
Follow Everything Econ: YouTube · TikTok · X · Instagram · Facebook
Keep exploring
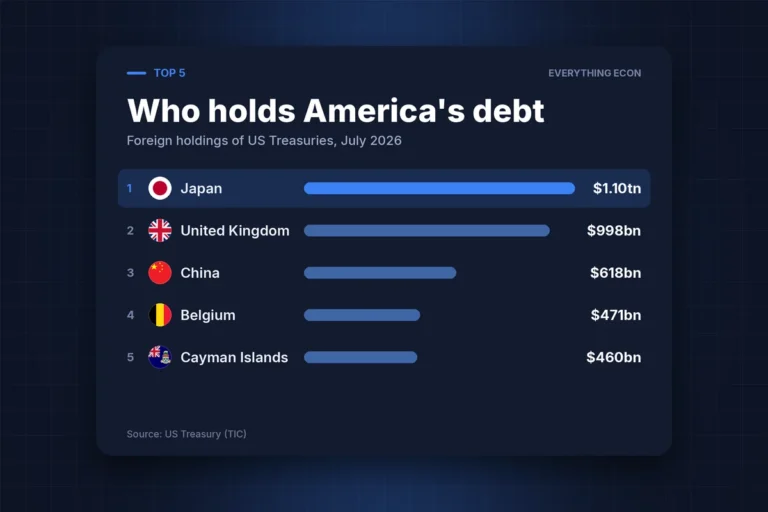 Economy · GraphicWho Holds America’s Debt? The $9.25tn Owned Abroad407K views3 min read
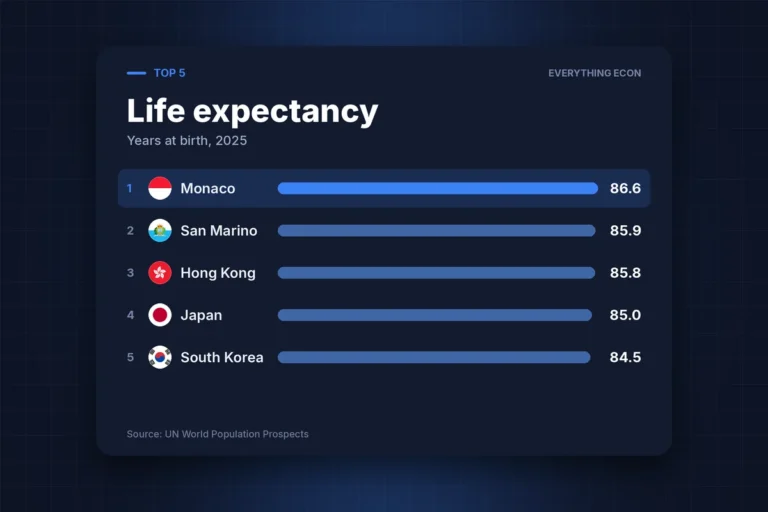 Economy · RankingThe Countries Where an Extra Three Decades of Life Comes as Standard293K views3 min read
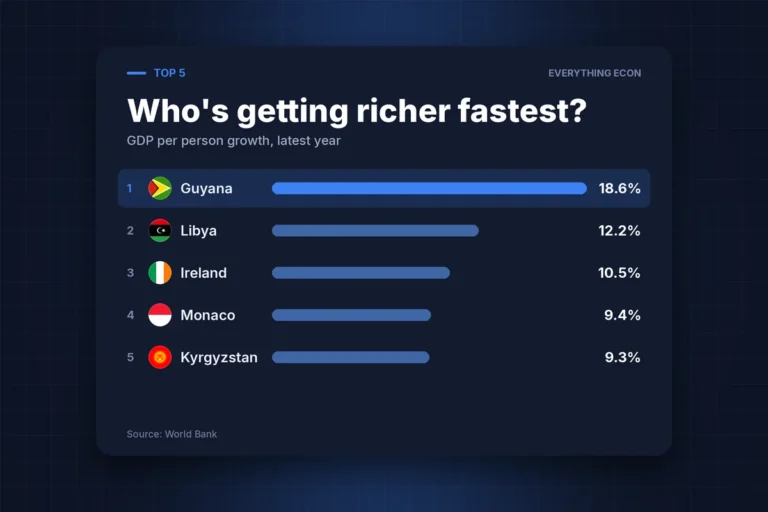 Economy · RankingThe Countries Where Money Is Growing Fastest — and Where It’s Vanishing279K views3 min read