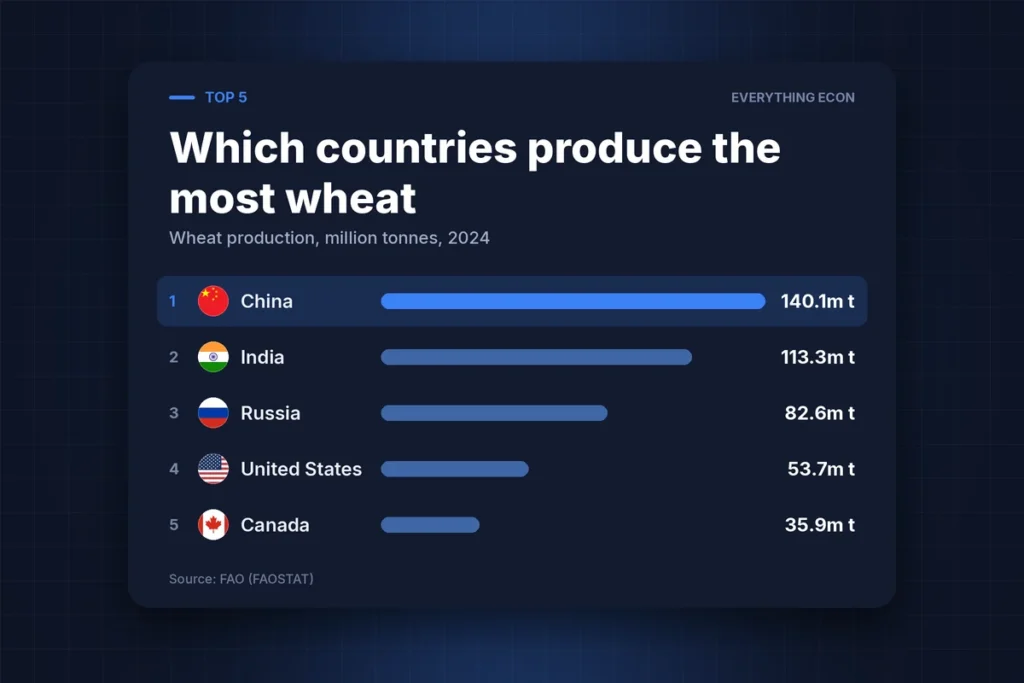
China, India and Russia together harvested 336.0m t of wheat in 2024, some 42% of a world crop of 798.5m t. Wheat is the most widely grown food crop on earth and the main calorie source for billions of people, so where it is grown, and who has to buy it from abroad, shapes food prices and diplomacy alike. The figures here are FAO production estimates for calendar year 2024, the latest complete year, measured in million tonnes of grain.
At a glance · Top 5
Wheat production, million tonnes, 2024
- 1China140.1m t
- 2India113.3m t
- 3Russia82.6m t
- 4United States53.7m t
- 5Canada35.9m t
Source: FAO (FAOSTAT)
Three giants that mostly eat their own crop
China leads with 140.1m t, 17.5% of world output, ahead of India on 113.3m t and Russia on 82.6m t. China gets far more from each hectare than its rivals: 5.9 tonnes per hectare against 3.6 in India and 3.1 in Russia, thanks to irrigation and heavy fertiliser use. Russia makes up for lower yields with sheer area, harvesting wheat from 27.0m hectares.
The similarity ends at the border. China and India feed very large populations and export almost nothing: China shipped under 4,000 t abroad in 2024 and India 72,000 t. China actually imported 12.5m t on top of its own crop. Russia is the opposite case. Its harvest fell 21% from a record 104.2m t in 2022, yet it still exported 32.7m t in 2024, more than any other country.
The exporters: the United States, Canada and Australia
The United States grew 53.7m t, Canada 35.9m t and Australia 34.1m t. Their populations are small relative to their farmland, so they export a large share of what they grow. In 2024, Canada shipped 25.5m t, equal to 71% of its crop, the United States 21.8m t and Australia 19.7m t, roughly 58%. (Trade and harvest years do not align exactly, so these ratios are approximate.)
Australia shows how little wheat has to do with population. It produced 34.1m t in 2024, more than the whole of Africa at 26.1m t. Africa has about 1,515m people against Australia's 26.7m, some 57 times as many. Australia's yield is modest at 2.6 tonnes per hectare because rainfall is low and erratic, but it farms 13.1m hectares of wheat and few people to feed with it. Its 2023 crop of 28.0m t also beat Africa's 26.2m t.
Europe, and Ukraine since 2022
The 27 EU countries together produced 119.4m t, about 15% of the world total, which would place the bloc a clear third behind China and India. France is the largest member at 26.6m t and Germany the second at 18.5m t. France's 2024 harvest was 26% below its 36.0m t of 2023, a reminder that even the highest-yielding wheat systems, at around 6 tonnes per hectare, remain exposed to the weather.
Ukraine produced 32.2m t in 2021, the year before Russia's full-scale invasion. Output fell to 20.7m t in 2022 and had only recovered to 22.4m t by 2024, still about 30% below the pre-war level. Ukraine exported 20.7m t in 2024, nearly equal to its harvest, so a country that is only ninth in production remains a major supplier to importers in the Middle East and Africa.
Africa and Egypt: growing less than they eat
Africa produced 26.1m t in 2024 but imported 47.6m t, so purchases from abroad were about 1.8 times the continent's own harvest. Egypt is the sharpest example. It grew 9.4m t, a respectable crop by African standards, but imported 13.1m t, 60% more than the 8.2m t it bought in 2023. Its wheat is grown in a desert climate under irrigation, which limits how far output can expand.
That leaves importing countries exposed to the decisions of a handful of exporters. When Russian or Ukrainian supply is disrupted, or when a bad harvest hits France or Canada, the price change reaches Cairo, Algiers and Lagos quickly. Algeria alone imported 6.9m t in 2024, Morocco 5.1m t and Nigeria 5.0m t.
Source: FAO, FAOSTAT crop production, trade in crops and livestock products, and population datasets, data for 2024 (calendar year). Trade figures are FAOSTAT wheat import and export quantities for 2024. See FAOSTAT crops and livestock products.
Get a new data story like this every week — join the newsletter.
Browse every visualisation on the visualisations page.