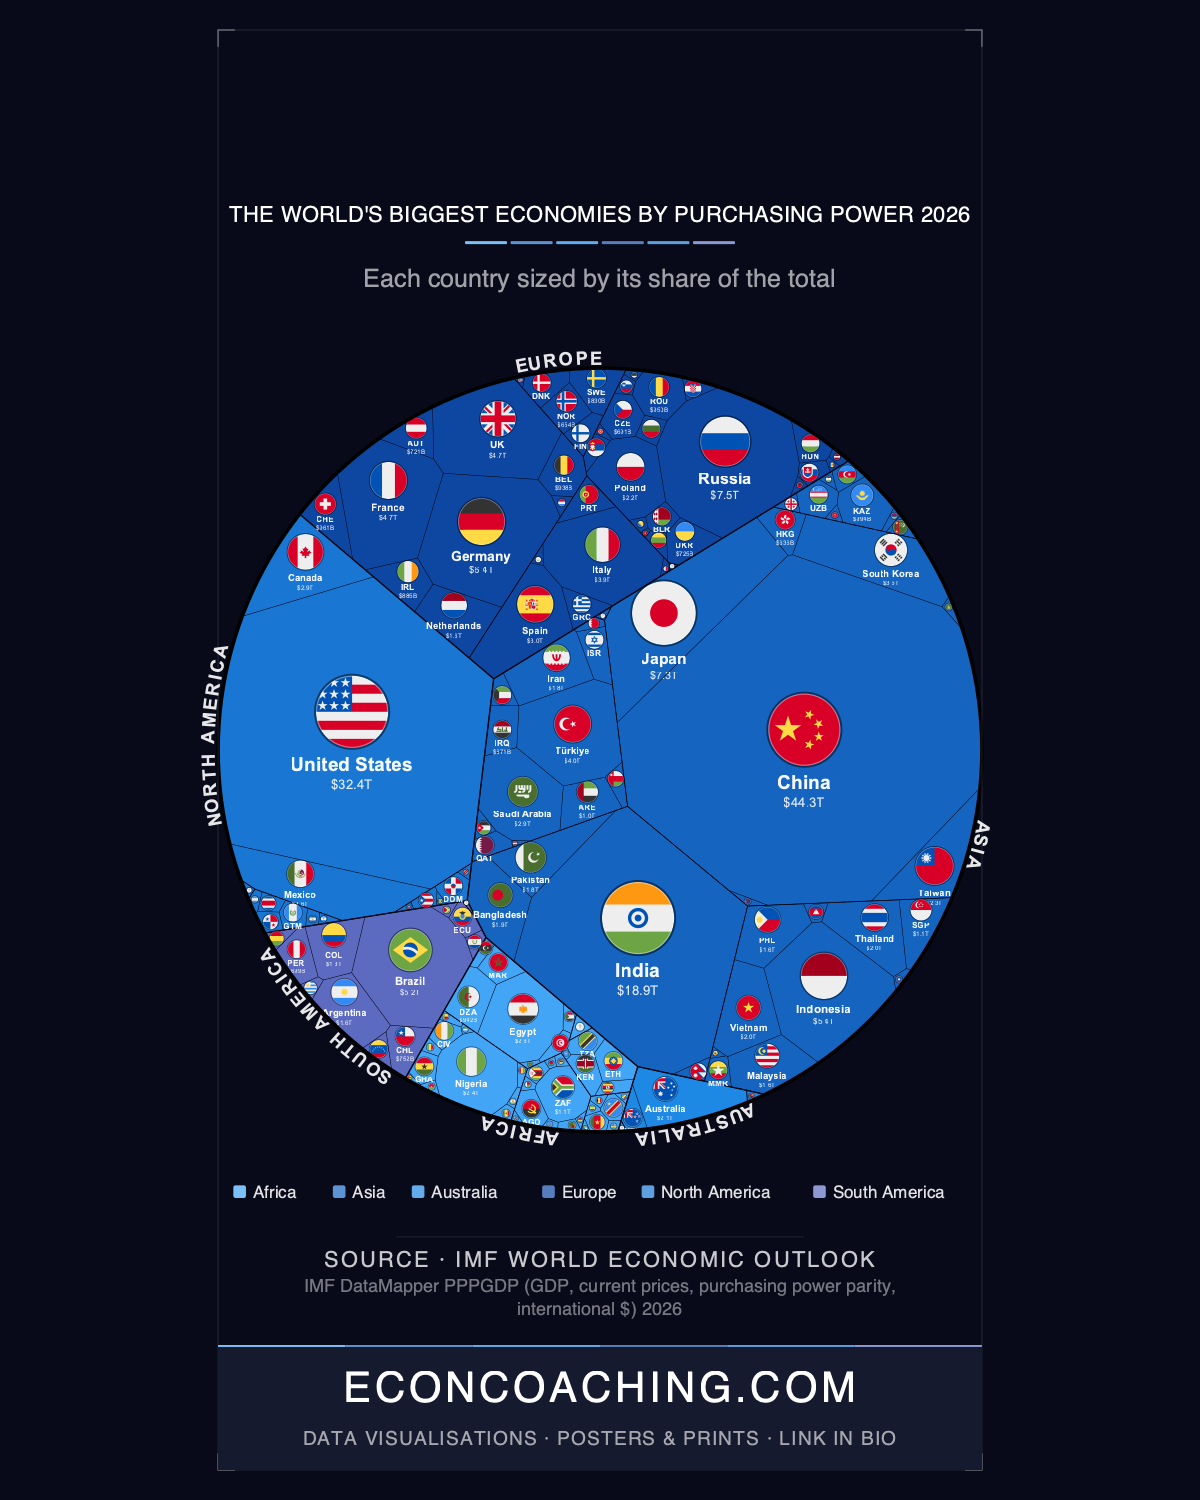
China's economy, adjusted for purchasing power, is now roughly 37% larger than the United States' — $44.3 trillion against $32.4 trillion — even though the US remains the world's largest economy when measured at market exchange rates. That gap is the central distortion in the treemap accompanying this article, where each country's cell is sized by PPP-adjusted output rather than geography. China's block alone equals 19.93% of the $222.2 trillion the world produced in 2026, nearly one dollar in five of everything made on Earth. The rankings that follow from this measure differ sharply from the ones most people carry in their heads, built as those are on nominal GDP tables where the US sits comfortably on top and Japan and Germany outrank Russia and India.
Why China's Lead Predates the Nominal Story by a Decade
Purchasing power parity strips out exchange-rate distortion and prices goods at what they actually cost to buy within each country, which is why China's PPP total has exceeded America's since around 2014, according to IMF data. The US is still projected to hold the larger economy in nominal terms for years yet. That decade-plus lag matters: PPP shifts have historically led nominal-GDP shifts, meaning today's PPP rankings are a preview of where market-exchange-rate rankings tend to drift over time. The caveat is that PPP measures total output, not prosperity. China's $44.3 trillion is inflated by a population of more than 1.4 billion; per-capita PPP output in China remains well below that of the US, Germany or Japan, so the treemap's largest cell says more about scale than about living standards.
India Overtakes Japan and Germany, on Two Different Clocks
India's PPP-adjusted economy, at $18.9 trillion, is now larger than Japan's and Germany's combined ($13.7 trillion). India crossed both of those countries by PPP years ago, but only in December 2025 did India's government confirm it had also overtaken Japan in nominal GDP, making India the world's fourth-largest nominal economy. Germany is next: India is on pace to pass it in nominal terms by roughly 2031. The sequencing repeats the pattern set by China a decade earlier, PPP rank changes arriving first, nominal rank changes catching up years later.
Russia Sits Ahead of Japan and Germany Despite Sanctions
Russia's $7.5 trillion PPP economy exceeds Japan's ($7.3 trillion) and Germany's ($6.4 trillion), making it the fourth-largest economy in the world by this measure, a position it has held since overtaking Germany around 2021 and has kept through the sweeping Western sanctions imposed after its 2022 invasion of Ukraine. That ranking needs a direct qualifier. Part of Russia's elevated PPP figure reflects wartime price distortions, capital controls, import substitution and non-market pricing rather than broad-based prosperity, and some analysts argue current PPP benchmarks have not fully absorbed the post-2022 sanctions shock. Nominally, Japan and Germany still outrank Russia, a reminder that the PPP table is not a ranking of who is richest.
Indonesia's Jump Into the Top Ten
Indonesia enters the global top 10 by PPP at rank 7, with $5.4 trillion, despite typically sitting well outside the top 15 by nominal GDP, the largest nominal-to-PPP rank jump among major economies in this dataset. The move echoes a broader Southeast Asian growth story: Vietnam was ASEAN's fastest-growing economy in the first half of 2026, with GDP growth accelerating to 8.18%, more than double the pace of Thailand (5.1%) and well ahead of the Philippines (6%). Indonesia's climb and Vietnam's growth rate both point to the same regional dynamic, manufacturing and consumption expansion pulling Southeast Asian economies up rankings built on exchange-rate comparisons that undervalue their domestic price levels.
Regional Leaders Aren't Always Who You'd Expect
Africa's largest economy by PPP is Egypt, at $2.57 trillion (global rank 18), ahead of Nigeria's $2.42 trillion (rank 19) and well ahead of South Africa's $1.07 trillion (rank 33), even though South Africa is usually cited as the continent's biggest economy on a nominal basis. In South America, Brazil's $5.2 trillion is more than three times the size of Argentina's $1.6 trillion, the widest gap between a region's first- and second-largest economy among the continents in this dataset. Oceania shows a similar concentration: Australia alone generates about 84% of the region's $2.49 trillion in PPP output. These rankings aren't fixed points. The International Comparison Program periodically revises the price-level benchmarks behind PPP calculations, and close calls, such as France's $4.7 trillion sitting almost level with the UK's $4.7 trillion, or Nigeria trailing Egypt by a comparatively narrow margin, can shift with methodology updates rather than any real change in output.
What the Rankings Signal Going Forward
China, the US and India together produce nearly 43% of global output by PPP, $95.6 trillion of $222.2 trillion, and the rank changes crystallising in 2026, India's confirmed nominal overtake of Japan, Russia's sustained rank 4 position, Indonesia's arrival in the top 10, suggest the gap between the PPP world and the nominal world that most people recognise is more likely to narrow than to reverse. Whether that convergence plays out on China's decade-long timeline or faster will shape how the US-China rivalry, sanctions policy toward Russia and India's growth trajectory get discussed over the next several years.
For more data-driven analysis of global economics and the trends reshaping the world economy, visit econcoaching.com.
Take this one home
Get this visualisation as a download, wallpaper, or printed poster.
← Back to all visualisations & articles
Follow Everything Econ: YouTube · TikTok · X · Instagram · Facebook