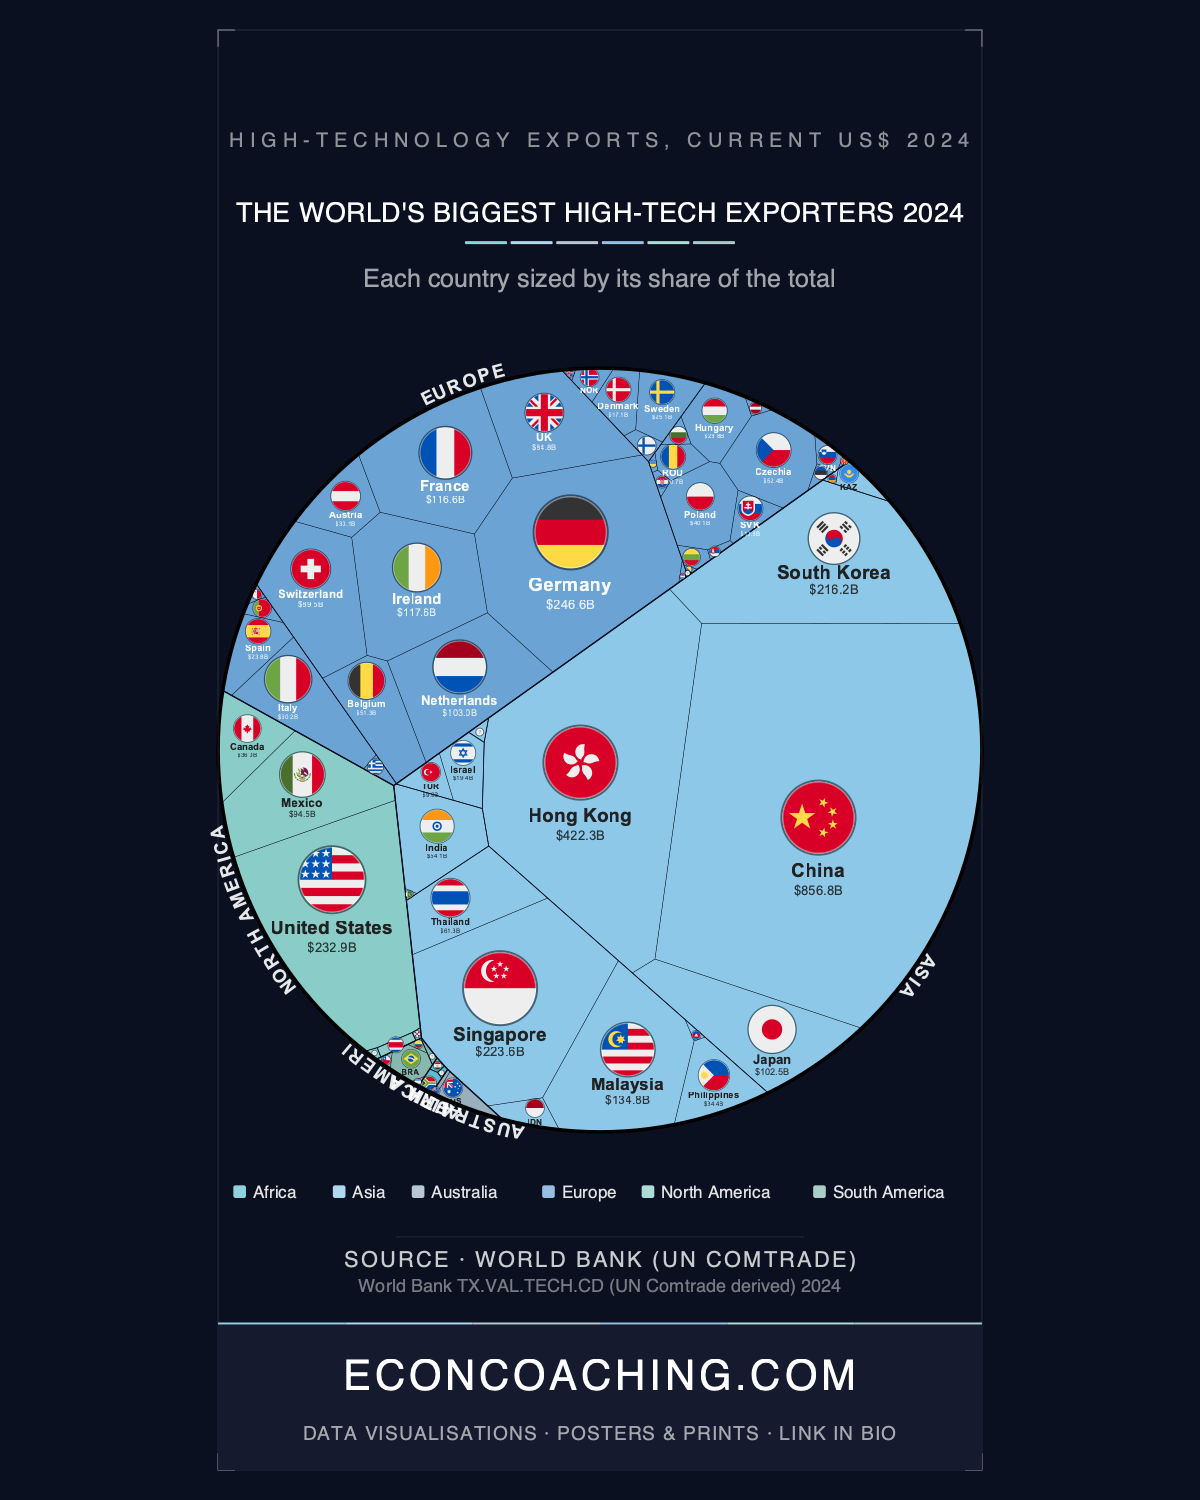
China's $856.8 billion in high-tech exports is larger than the combined total of the United States, Germany, South Korea, and the Netherlands. In the treemap accompanying this article, where cell area is proportional to export value rather than land mass or population, China's rectangle occupies nearly a quarter of the entire chart — and the distortion compounds from there. Hong Kong, a city of 7.5 million, appears larger than Germany. Ireland, with 5.1 million people, sits visibly ahead of Japan's 125 million. Africa, all 54 countries of it, is nearly invisible. Global high-tech exports reached $3.7 trillion in 2024, growing roughly 9% year-on-year as AI-driven semiconductor demand outpaced overall merchandise trade growth — and the geography of who captures that growth has rarely looked more concentrated.
Asia's Structural Grip on the High-Tech Economy
Asia accounts for 58.3% of global high-tech exports — $2.16 trillion — while all of Africa combined produces $3.8 billion, a ratio of roughly 565-to-1 between the two continents. That single comparison does more analytical work than any policy report. China at 23.15%, Hong Kong at 11.41%, South Korea at 5.84%, Singapore at 6.04%, and Malaysia at 3.64% collectively constitute a regional concentration with no precedent in the history of manufactured export trade. China's dominance in particular reflects decades of deliberate industrial policy: in the 1990s, the United States was the world's leading high-tech exporter; China's ascent to its current position was shaped explicitly by the Made in China 2025 programme, which targeted semiconductors, AI, and aerospace as strategic priorities. The headline figure, however, requires one important qualification: China's $856.8 billion includes production by foreign multinationals — Apple and Samsung among them — assembling goods at Chinese plants. Under current OECD classification frameworks, the domestic Chinese value-added is substantially lower than the aggregate figure implies.
Hong Kong's Chip Conduit and Its Structural Fragility
Hong Kong's position as the world's second-largest high-tech exporter, at $422.3 billion and 11.41% of global exports, is almost entirely a re-export story rather than a manufacturing one. Electronic integrated circuits alone account for 34.4% of Hong Kong's total exports, making it the world's top exporter of chips by value in 2024. In the first five months of 2025 alone, Hong Kong re-exported $124 billion worth of chips to mainland China — roughly 52% of China's total chip purchases over that period, according to HKTDC data. The AI boom has transformed Hong Kong into an indispensable logistics node for semiconductor flows into China precisely because US export controls have complicated direct shipment routes. That structural role is also the source of its structural fragility: Hong Kong has no chip fabrication capability, and any escalation in US-China trade policy — including potential loss of its special customs status — would leave its #2 global ranking exposed. Singapore and Malaysia function as parallel conduits, with Singapore's high-tech exports rising 13% in 2024 on the back of a 19.5% jump in processor and integrated circuit shipments, partly reflecting supply chain rerouting driven by the same US export control regime.
Ireland and the Limits of the Export Headline
Ireland's $117.6 billion in high-tech exports places it eighth globally, ahead of Japan's $102.5 billion — a comparison that reads as implausible until you examine the composition. Ireland hosts 9 of the world's top 10 pharmaceutical companies, is the world's third-largest pharmaceuticals exporter, and its pharma and medical product exports reached €99.9 billion in 2024, according to Enterprise Ireland figures. The country manufactures an estimated 80% of the world's stents and 75% of global orthopaedic knee devices — product concentrations of a kind normally associated with countries with manufacturing sectors an order of magnitude larger. Ireland's transformation from one of Europe's poorest economies in the 1980s into a global pharma-medtech hub was engineered through IDA Ireland's FDI strategy, a 12.5% corporate tax rate, and EU single market access compounded over four decades. The counterpoint matters here too: Ireland's export headline is heavily shaped by transfer pricing practices among multinational firms; the economic value retained domestically in employment, R&D spending, and tax revenue is real but substantially smaller than the $117.6 billion figure suggests.
Germany's Decline and Central Europe's Rise
Germany's high-tech exports fell 10.6% in 2024 — the steepest annual decline in years — while France dropped 1.7%. Both contractions reflect structural pressures rather than cyclical weakness: elevated post-Ukraine energy costs have eroded German manufacturing competitiveness, and intensifying Chinese EV competition has compressed the industrial base. The OECD's 1997 high-tech classification framework, which has not been fundamentally revised, does not classify solar panels or EV batteries as high-technology products — meaning Germany's green industrial export pivot is largely invisible in this dataset, and its true innovation-intensive share may be higher than the headline implies. Against Germany's contraction, Czechia posted 13.4% high-tech export growth in 2024 to reach $52.4 billion, outpacing both Western European stalwarts and positioning Central Europe as an increasingly significant node in the continent's technology supply chain.
India's Scale Paradox and Africa's Structural Gap
India, the world's most populous country at 1.4 billion people, ranks 17th globally with $54.1 billion in high-tech exports — trailing Ireland by more than $63 billion despite having 275 times the population. India's electronics manufacturing sector has grown sixfold since 2014–15, from approximately $21.4 billion to $125 billion in gross output by 2024–25, driven by the Production Linked Incentive scheme and a deliberate effort to attract semiconductor investment flagged at Semicon India 2024. But high-tech export value captures more than manufacturing volume; it reflects the precision, IP intensity, and classification of goods. Africa's structural position is illustrated most sharply by South Africa, the continent's largest high-tech exporter at just $2.45 billion, whose top export categories remain gold, platinum, and minerals — confirming that Africa's near-zero high-tech share reflects deep industrial policy and infrastructure deficits, not a measurement artefact.
The 2024 data is a snapshot of a system already under active pressure from the 2025 tariff wave, US semiconductor export controls, and an AI-driven demand surge that is redrawing chip trade routes in real time. Whether India's approved $19 billion in semiconductor investments, Mexico's $94.5 billion high-tech export base built partly on surging EV shipments, or Czechia's accelerating trajectory can meaningfully shift the treemap's geometry over the next five years is the core question this ranking raises — and one that will be answered by investment decisions being made now.
One chart like this in your inbox each week, explained in plain English — join the Everything Econ newsletter. Always free, and you can unsubscribe any time.
Take this one home
Get this visualisation as a download, wallpaper, or printed poster.
← Back to all visualisations & articles
Follow Everything Econ: YouTube · TikTok · X · Instagram · Facebook