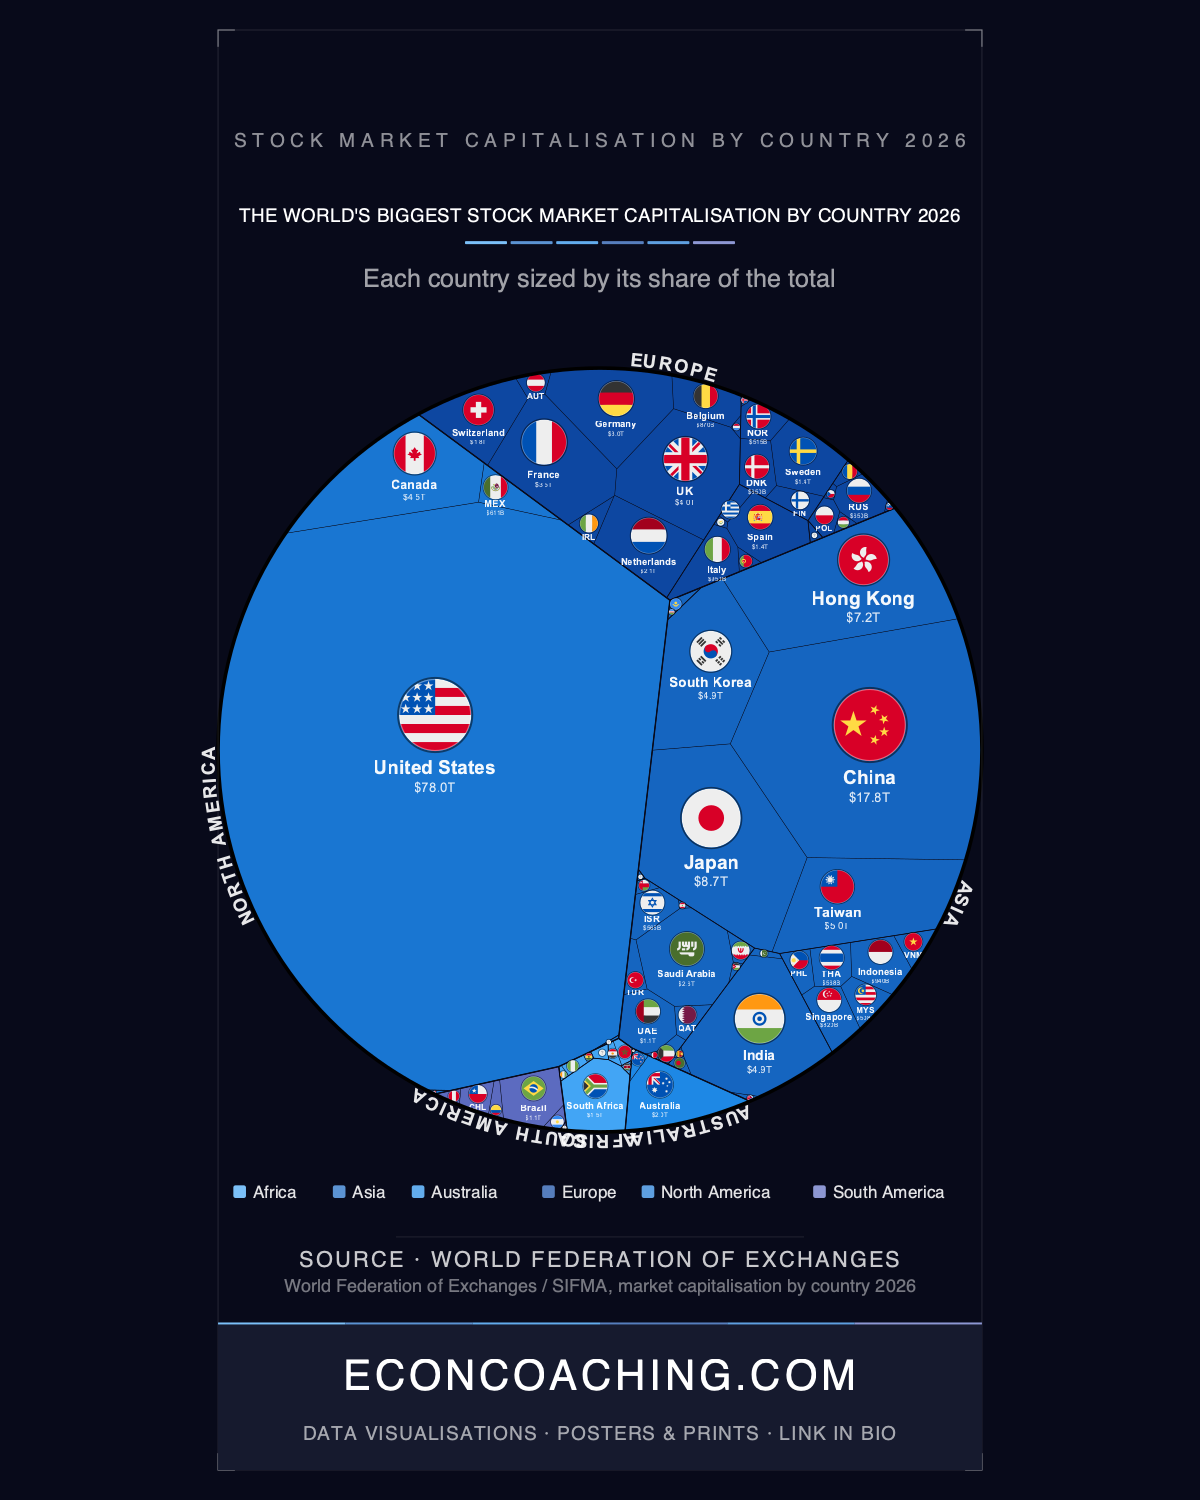
The United States alone is worth $77.95 trillion in listed equity, more than China, Japan, Hong Kong, Taiwan, India, South Korea, Canada, the United Kingdom and France combined, which together add up to roughly $60.45 trillion. That single comparison, visible in the treemap accompanying this article where cell size tracks market value rather than land area, is the starting point for reading the rest of the 2026 rankings. The US share of the $169.2 trillion global total stands at 46.07%. Add Canada and Mexico, and North America accounts for 49.1% of all listed equity on Earth, meaning three countries hold about half the world's public market wealth.
The Mega-Cap Rally Behind the Number
America's dominance is not evenly spread across thousands of companies. Nvidia's market capitalisation, at roughly $5.09 trillion, is larger than the combined public stock markets of every country in Africa and South America put together, which total about $3.70 trillion. Widen the lens slightly and the concentration becomes starker: Nvidia, Alphabet, Apple, Microsoft and Amazon together carry a combined market cap of around $20.8 trillion, a sum that exceeds the total GDP of Europe's five largest economies. That is a handful of companies, not a broad national economy, generating a share of global wealth larger than entire continents. It also means the US figure sitting atop the global rankings is disproportionately exposed to the fortunes of five AI-era firms. A sharp correction concentrated in Nvidia, Apple, Microsoft, Alphabet or Amazon would not just dent the US market, it would mechanically shift the entire world ranking, since so much of the $169.2 trillion total now sits inside those five balance sheets.
Why China's Market Looks Small Next to Its Economy
China's stock market is worth $17.75 trillion, second globally and 10.49% of the world total, but that figure understates the scale of China's real economy relative to America's. Market capitalisation measures the value of what is publicly listed and freely traded, not total output. China's economy runs heavily through state enterprises and privately held firms that never list on an exchange, and capital controls limit how freely shares move in and out of Chinese markets. The result is a listed market worth less than a quarter of America's $77.95 trillion, even though the two economies are far closer in real productive terms. The lesson for anyone reading a treemap like this one is that market cap rankings measure financial market depth and openness as much as they measure economic weight.
When One Company Is Two-Thirds of a Country
Saudi Arabia's entire stock market is valued at $2.63 trillion, and Saudi Aramco alone accounts for roughly $1.7 to $1.8 trillion of that, close to two-thirds of the national total. A single company, the state oil producer that carried out the largest IPO in history on the Riyadh exchange in 2019, effectively is the Saudi stock market. Africa shows the same pattern at continental scale. South Africa's market is worth $1.53 trillion, almost 79% of the entire African continent's $1.95 trillion in listed equity, with the Johannesburg Stock Exchange functioning as the region's dominant venue. South America follows the same script: Brazil alone accounts for $1.10 trillion of the region's $1.75 trillion total, nearly 63%. In each case, a country or continent's headline number is really the story of one dominant listing or one dominant exchange, not broad-based market depth.
The Fourth Place That Keeps Changing Hands
Rankings below the top three are far less stable than they appear on any single day. India and Hong Kong have swapped the position of world's fourth-largest stock market at least three times since January 2024, with margins as thin as $30 to $40 billion separating them at the moment of each flip. In 2026 they sit close together again, India at $4.92 trillion and Hong Kong at $7.25 trillion in the current ranking, a reminder that a snapshot ranking can shift within months. Higher up the table, China's position relative to Japan tells a longer version of the same story. China's market first overtook Japan's in late 2014 and passed $10 trillion in 2015, then lost the number two global spot back to Japan in 2018 during the US-China trade war. By 2026 China has rebuilt to $17.75 trillion against Japan's $8.70 trillion, roughly double. A ranking that looked settled in 2015 was reversed by 2018 and reversed again since, which is the argument for treating any single year's order as a snapshot rather than a verdict.
Asia's Concentration and the Pacific's Lopsided Total
Asia holds 34% of world stock market value, but that share is not spread across the continent. Five East Asian markets, China, Japan, Hong Kong, Taiwan and South Korea, account for nearly 26 of those 34 percentage points on their own. Oceania shows an even sharper skew: Australia's $1.97 trillion market makes up about 95% of the entire region's $2.07 trillion, with New Zealand contributing just $100.5 billion. Global market capitalisation has grown from roughly $64 trillion in 2013 to well over $150 trillion by the mid-2020s, and the 2026 total of $169.2 trillion marks a fresh record, but that growth has been distributed as unevenly as the map itself.
The concentration visible in this treemap, one country matching nine others combined, one company outweighing two continents, raises the question of how much of the 2026 total depends on a small set of AI-linked valuations holding steady. Whether that concentration deepens further or starts to unwind will shape how the next version of this ranking looks.
For more data-driven analysis of global economics and the trends reshaping the world economy, visit econcoaching.com.
Take this one home
Get this visualisation as a download, wallpaper, or printed poster.
← Back to all visualisations & articles
Follow Everything Econ: YouTube · TikTok · X · Instagram · Facebook