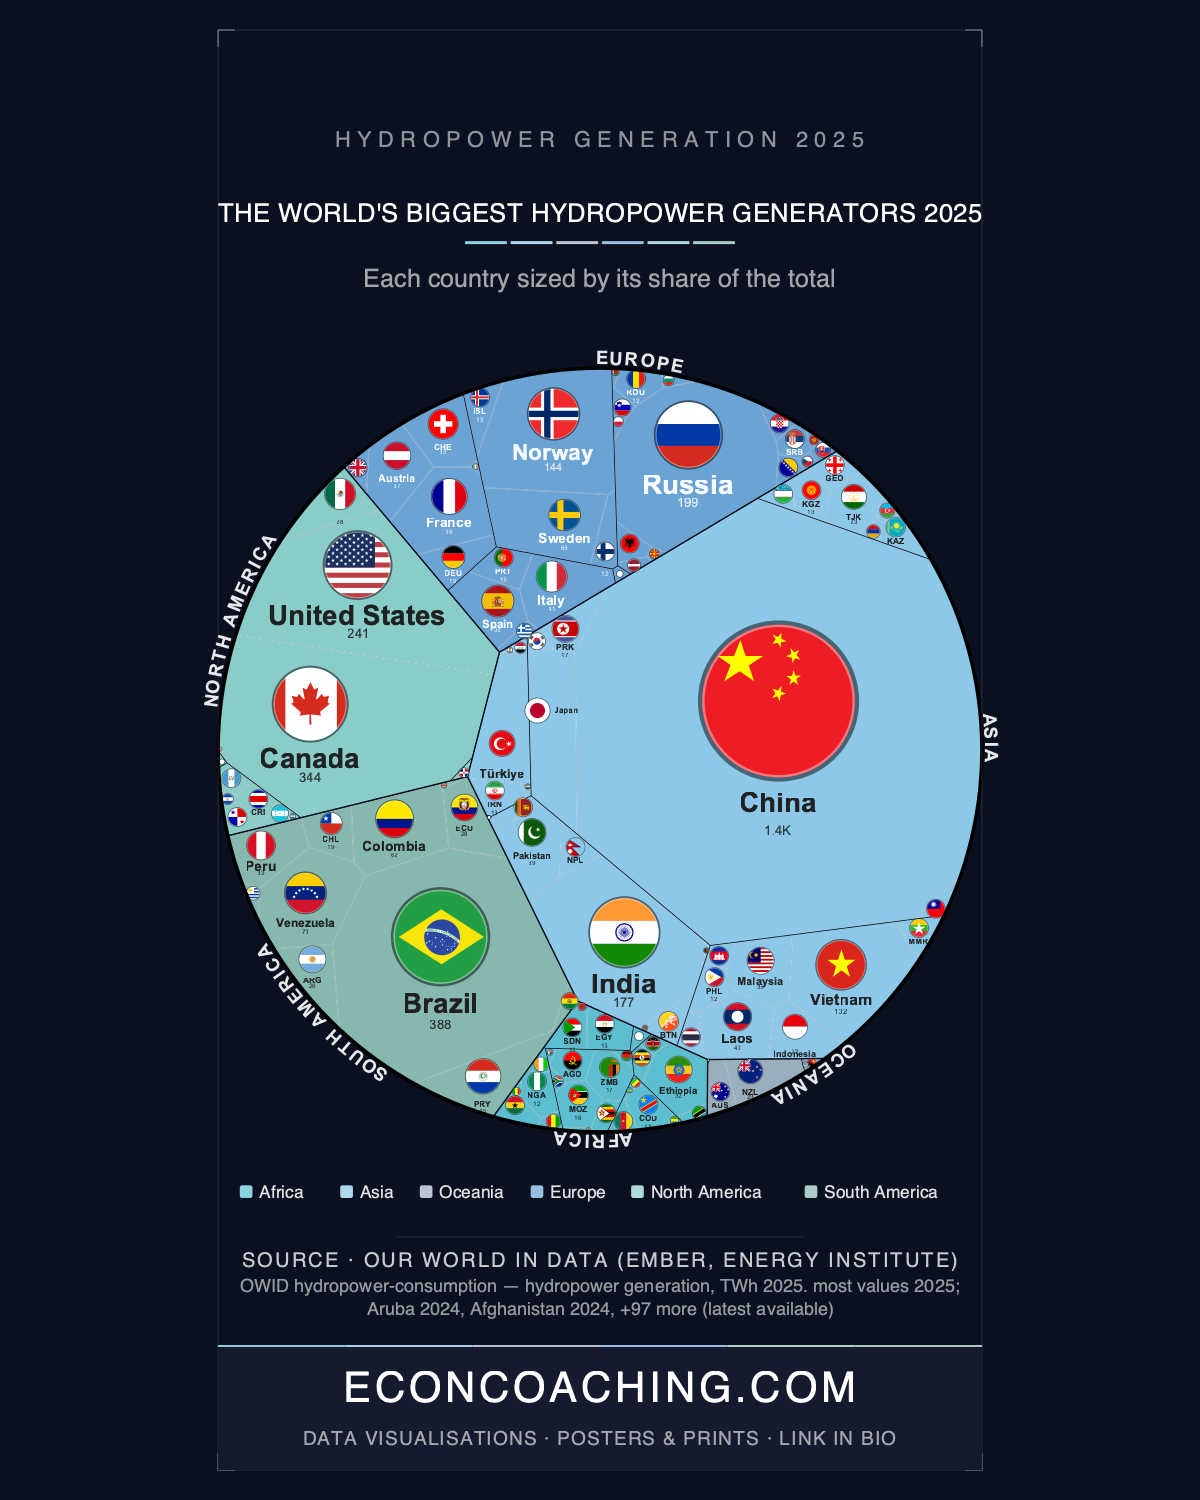
China generated 1,397 TWh of hydropower in 2025, more than Brazil, Canada, the United States, Russia and India combined, a group of five countries that together produced 1,354 TWh. The comparison shows up directly in the treemap accompanying this article, where cell size tracks output rather than geography: China's rectangle alone outweighs five other major economies stacked together. China and Brazil between them account for roughly 40.3% of the 4,427 TWh the world's 117 hydropower-producing countries generated in 2025, concentrating two-fifths of global output in just two countries. That concentration is now colliding with a run of droughts across three continents, raising the question of how resilient the world's largest renewable electricity source actually is.
Two Countries, 40% of the World's Output
China's 1,397 TWh is 31.56% of the global total on its own. Add Brazil's 389 TWh, 8.78% of the total, and the pair cross 40%. No other country comes close to either figure: third-placed Canada produced 345 TWh, and China's total is more than 3.5 times Brazil's. This is not a new pattern. China's Three Gorges Dam overtook Brazil and Paraguay's Itaipu Dam as the world's top annual electricity-producing single power plant back in 2012, and that single-plant lead has since scaled up into a country-level lead of similar proportions. A hydropower shortfall concentrated in either country, whether from drought, dam-safety failure, or geopolitical disruption, would move global clean-energy generation statistics more than a shortfall in almost any other combination of nations.
China Is Doubling Down With Medog
Rather than diversifying away from this concentration, China is deepening it. Construction formally began in July 2025 on the Medog Hydropower Station, a five-dam cascade on the Yarlung Tsangpo's Great Bend in Tibet. Planned capacity is around 60 GW, roughly triple the Three Gorges Dam, with a target of up to 300 TWh of annual output once complete, a figure that would add more than a fifth of China's current hydropower total from a single project. The site sits in a seismically active, geologically complex gorge, and the river continues downstream into India and Bangladesh, which gives the project transboundary water-security implications that complicate any straightforward "world's biggest dam" framing. Medog is a bet that scale and engineering can keep expanding China's lead rather than a hedge against the concentration risk the current rankings already show.
Drought Is Testing the "Reliable Baseload" Assumption
Hydropower's traditional pitch is predictability, and recent years have undercut that. US hydropower generation fell to a 23-year low during 2023-2024, as a prolonged Pacific Northwest drought cut Columbia River Basin output roughly 23% below its 10-year average, before recovering back toward the 242 TWh seen in the 2025 figures, the fourth-largest national total. Europe's Alpine hydropower fleet, concentrated in Austria and Switzerland, saw reservoir inflows run nearly 50% below average in July amid a worsening summer drought, a blow to a continent that already supplies only 16.9% of world hydropower output. Uruguay suffered its worst drought in more than 70 years during 2024-2025, part of a wider El Niño-linked drought that cut output across several South American grids even as the region as a whole, at 686 TWh, supplies over 15% of world hydropower. Three separate continents recording historic or near-historic drought stress within the same few years is hard to square with hydropower's reputation as the stable member of the renewables mix.
Ethiopia's Dam and the Limits of Scale
Not every hydropower story in 2025 was about concentration at the top. Ethiopia officially inaugurated the Grand Ethiopian Renaissance Dam on 9 September 2025, 14 years after construction began, capping one of the most contested infrastructure projects in modern African history. Its 5,150 MW capacity is projected to add about 15.7 TWh a year, which would roughly double Ethiopia's electricity generation given the country's current 32 TWh national hydropower total. That is a transformative addition for Ethiopia and barely registers against China's 1,397 TWh or the 4,427 TWh global total, a reminder that the countries for whom hydropower matters most domestically are often nowhere near the top of the world ranking. Norway illustrates the same split from the opposite direction: its 145 TWh ranks only seventh in the world, yet hydropower supplies roughly 88-90% of the electricity Norway itself consumes, one of the highest reliance rates of any economy on Earth. New Zealand's 24 TWh is a tiny 0.54% sliver of the global total but covers roughly 55% of the country's own domestic electricity supply. World ranking and domestic dependence are measuring two different things entirely.
A Pivot From Generation to Storage
Hydropower remains the largest single source of renewable electricity worldwide, supplying about 14% of global electricity generation in 2025, more than wind or solar individually, despite drawing far less public attention than either. But its growth has stalled: the IEA forecasts global hydropower generation rising only about 7% between 2025 and 2030, well behind wind and solar. At the same time, annual pumped-storage hydropower capacity additions are set to double, reaching 16.5 GW a year by 2030. The sector's role is shifting from adding new generation to balancing grids that are increasingly built around intermittent wind and solar.
That shift matters more than the headline rankings suggest. As China pushes Medog toward completion and droughts continue testing reservoirs from Oregon to the Alps to Uruguay, the countries that built their power systems around large-scale conventional hydropower face a choice between expanding generation capacity in increasingly concentrated and climate-exposed locations, or redirecting investment toward the storage role the IEA's pumped-hydro forecasts point to.
Sign up to the econcoaching.com newsletter for more chart-led breakdowns of global economic data. For more data-driven analysis of global economics and the trends reshaping the world economy, visit econcoaching.com.
Take one home
Every country drawn to scale, as an instant printable download or a museum-quality matte poster printed to order.
← Back to all visualisations & articles
Follow Everything Econ: YouTube · TikTok · X · Instagram · Facebook