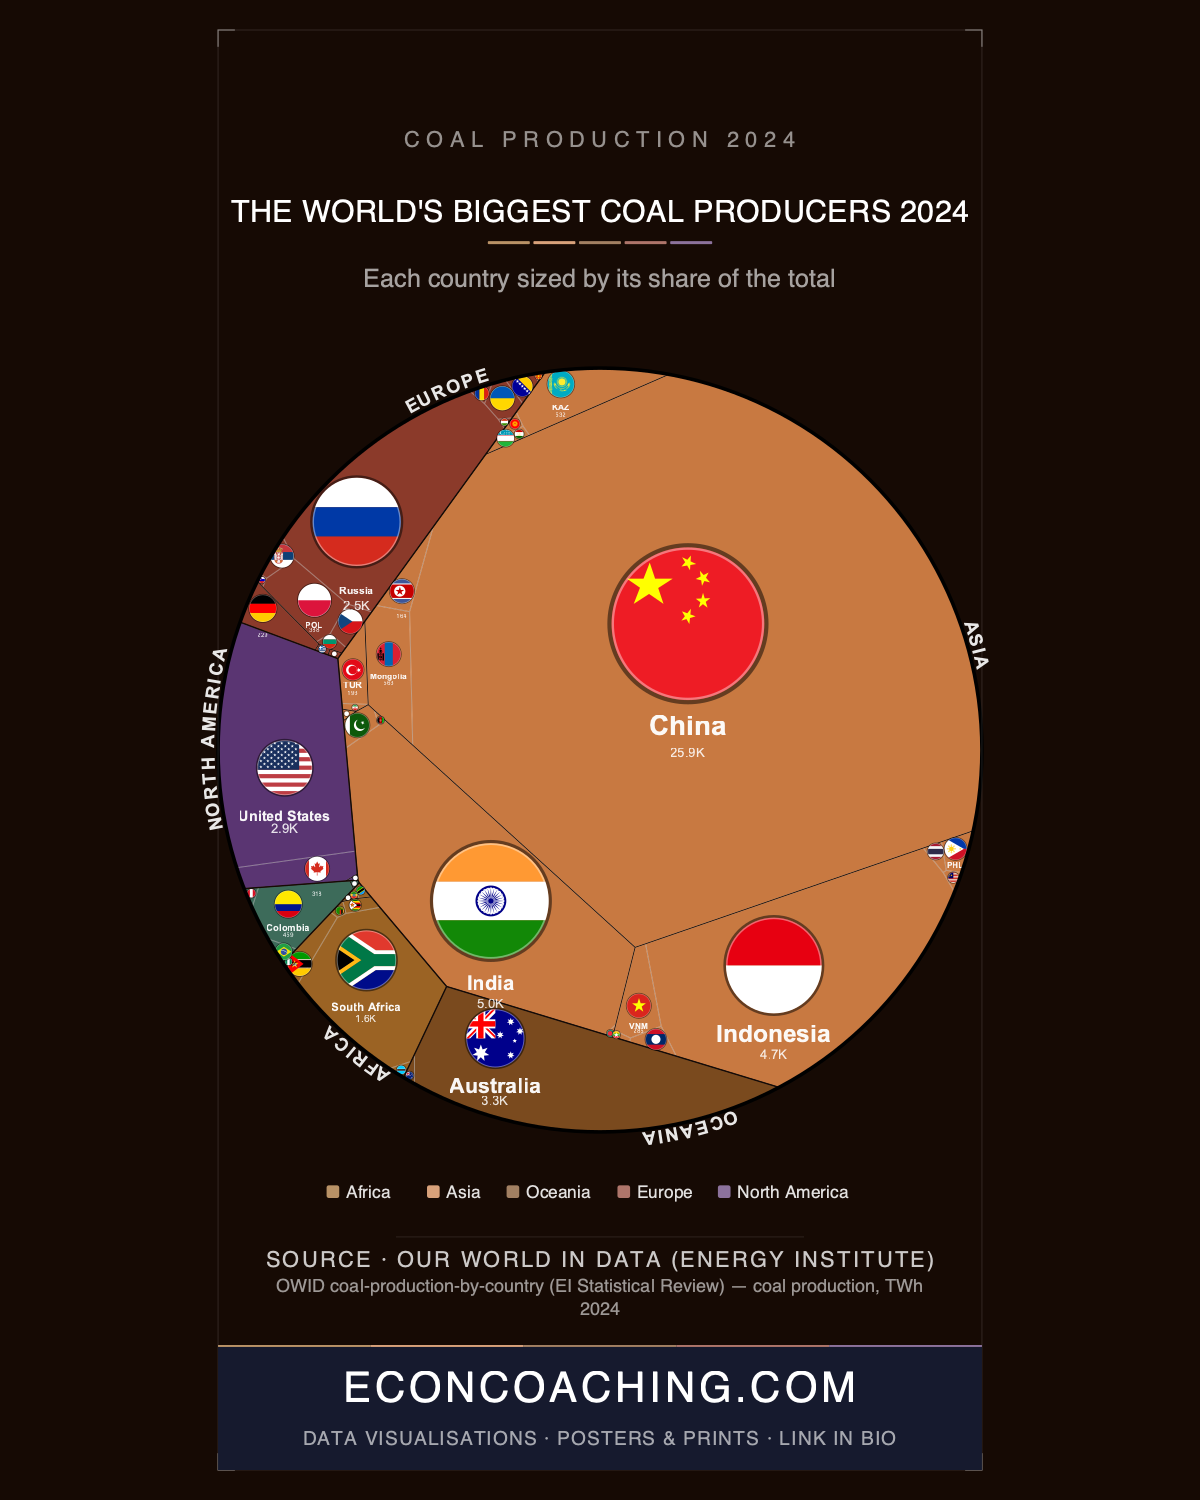
China produced 25,916 TWh of coal in 2024, equal to 51.65% of the 50,178 TWh captured in this chart, and the treemap built from that data shows China's cell alone exceeding the combined output of the next 19 countries on the list. That single comparison sets the terms for everything else in the 2024 data: a world where one country's coal sector outweighs almost the entire rest of the ranked field, even as China simultaneously leads global renewables deployment. The rest of the chart, from India's historic milestone to Germany's shrinking sliver, has to be read against that scale.
China's Share Dwarfs the Rest of the World
China's 51.65% share on this chart matches independent tonnage estimates, which put the country at 51.7% of global coal production, or 4.78 billion tonnes, in 2024. No other producer comes close: Russia, at sixth place with 2,533 TWh (5.05%), represents a tenth of China's output. The persistence of China's coal dependence traces back to the country's 2021 electricity shortages and blackouts, which pushed Beijing toward an energy-security-first policy that has kept mining capacity high even as China builds out solar and wind faster than any other country. Both things are true in the same economy at once: record coal output and record clean energy additions.
India Crosses the Billion-Tonne Line and Overtakes Indonesia
India produced over 1 billion tonnes of coal for the first time in its history in FY2024-25, reaching 1,012.9 million tonnes and overtaking Indonesia's 836 million tonnes. This chart's energy-equivalent ranking shows the same order: India at 4,990 TWh (9.94%) ahead of Indonesia's 4,714 TWh (9.39%). The two measures, tonnage and TWh, diverge slightly because calorific value differs by coal type and country, but the relative ranking of the top ten happens to match here. India's billion-tonne milestone follows roughly a decade of coal-block auction reforms designed to cut import dependence and secure domestic energy supply, and it arrived alongside Indonesia's slide to third place.
A Record Year That Complicates the "Coal Is Dying" Story
Global coal production hit a record 9.15 billion tonnes in 2024, according to the IEA, the fourth consecutive annual record, driven almost entirely by China, India and Indonesia. That record sits uneasily against any narrative of coal in terminal decline, and two data points in this chart reinforce it. Mongolia shipped a record 83.76 million tonnes of coal to China in 2024, up 25.6% year-on-year, with almost its entire export volume going to a single buyer, lifting Mongolia to eighth place with 564 TWh (1.12%). South Africa, seventh at 1,555 TWh (3.10%) and responsible for roughly 87% of Africa's entire coal output, grew exports by 10% even as domestic tonnage was essentially flat, down just 0.2%, because rail logistics bottlenecks at state operator Transnet capped how much could move. That gap between rising exports and flat production is a reminder that the two figures measure different things and can mask underlying stagnation. Worldwide electricity generated from burning coal, a separate measure from raw output, hit an all-time high of 10,766 TWh in 2024 per the IEA, underlining that coal's role in power generation keeps setting records alongside mining.
The Managed Decline: Germany and Colombia Diverge
Not every producer on this chart is expanding, but the reasons for decline differ sharply. Germany produces just 229 TWh of coal, 0.46% of the world total, and is legally committed under its 2020 Coal Phase-Out Act to exiting coal entirely by 2038, with the industrial state of North Rhine-Westphalia bringing its own deadline forward to 2030. Coal's share of German electricity has already fallen from 23.3% in 2020 to 20.4% in 2025, according to tracking from Agora Energiewende. That is a legislated, managed exit, not a market collapse. Colombia's decline looks different: tonnage output fell about 7.4% in 2024, to roughly 61 million tonnes, placing it tenth on this chart with 459 TWh (0.92%), and export revenue collapsed after President Gustavo Petro's government banned coal sales to Israel, a political decision layered on top of structurally weaker European demand. Business Standard and the Institute for Energy Research have both flagged this as a case where policy, not just price, is reshaping output.
Australia's Outsized Footprint and the Margins
Australia, with a population of about 26 million, produces 3,252 TWh of coal, fourth on the chart and not far behind the United States' 2,945 TWh from a population roughly 13 times larger, making Australia by far the heaviest per-capita coal producer among major economies. At the other end of the scale, Mongolia and Kazakhstan together account for 2.18% of world output, more than the entire continent of South America's 1.0%. North Korea is credited with 164 TWh, more than Ukraine, Czechia or Greece, one of the few economic data points published about the country's industrial base at all.
The IEA now projects global coal demand will merely plateau through 2026, with China's demand forecast to fall about 0.5% in 2025 and India's consumption also softening in early 2025. If that forecast holds, 2024's record, the one captured across this entire chart, may end up marking the peak rather than a step on the way up, which is precisely the question COP30 negotiators are pressing as they confront coal's staying power.
For more data-driven analysis of global economics and the trends reshaping the world economy, visit econcoaching.com.
Take one home
Every country drawn to scale, as an instant printable download or a museum-quality matte poster printed to order.
← Back to all visualisations & articles
Follow Everything Econ: YouTube · TikTok · X · Instagram · Facebook